Archibus SaaS / Maintenance / Corrective Maintenance / BIM Viewer
Maintenance / Corrective Maintenance / Supervisor / BIM Viewer
Assets / Assets / Asset Manager / BIM Viewer
Assets / Enterprise Assets / Facility Asset Manager / BIM Viewer
BIM Viewer: Review Equipment Diagnostics
If your site has implemented a BMS system for collecting equipment diagnostics, you can access summary statistics directly from the BIM Viewer. These statistics are helpful for planning work, avoiding costs, and ensuring business continuity.
Review Diagnostics for an Asset
Select an asset in the BIM model, and the Diagnostics tab, located in the lower portion of the pop-up Equipment Details form, displays diagnostics for the selected equipment item. The list shows all the equipment diagnostics for the equipment for the past 30 days, sorted in descending order by Date Start. Use the drop-down menu to select diagnostics for a longer time period, or set your own custom time period.
Note that the list presents all diagnostics for the item, not just those that generated work requests. By reviewing all diagnostics, you can catch issues before they become larger problems.
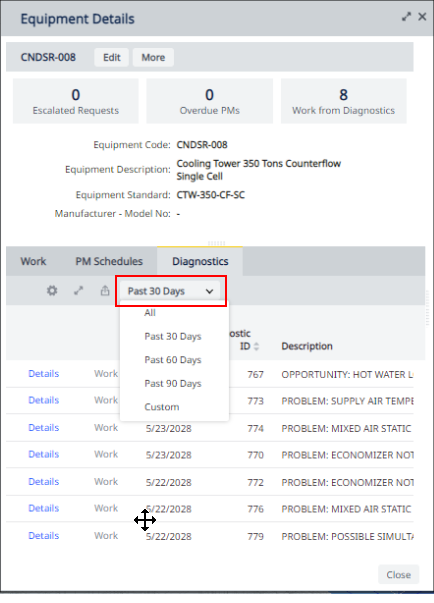
Click the Details field to open a pop-up window with all the fields of the Diagnostics (bms_eq_diagnostics) table.
Review Work Requests Generated from Diagnostics
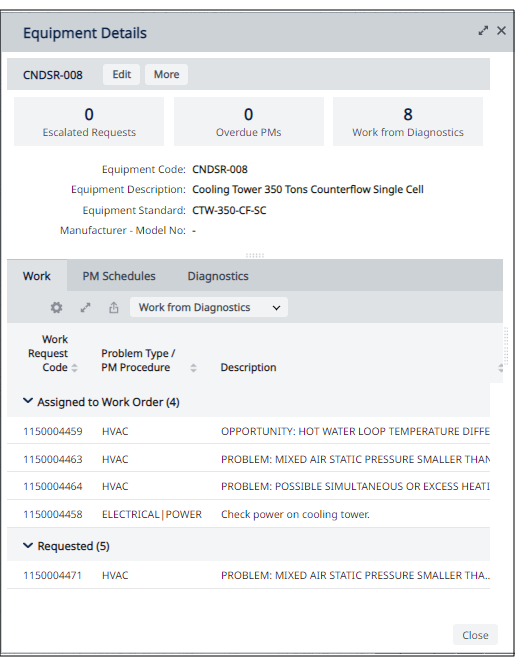
You can check if the selected asset has work requests that were generated from diagnostics; that is, an Archibus workflow rule checked diagnostic values, found the values met a certain threshold, and automatically generated the work request.
-
Select an asset in the BIM model. You may want to first highlight by diagnostics, as described below.
-
Click on the Diagnostics KPI in the Equipment Details form.
-
In the Work tab of the Equipment Details form, the drop-down filter automatically sets to Work from Diagnostics.
-
Click on a work request in this list to see its details. For information on the work request's diagnostic-related fields, see Using the Maintenance Console with BMS Integration.
Diagnostics Highlights
When the Work Requests tab is active, the Highlight menu offers two diagnostic-related highlights: Diagnostics, and High Priority Diagnostics. Use these highlights to locate assets for which diagnostics have been run. The darker shade of blue the highlight, the higher the count of diagnostics or high-priority diagnostics.
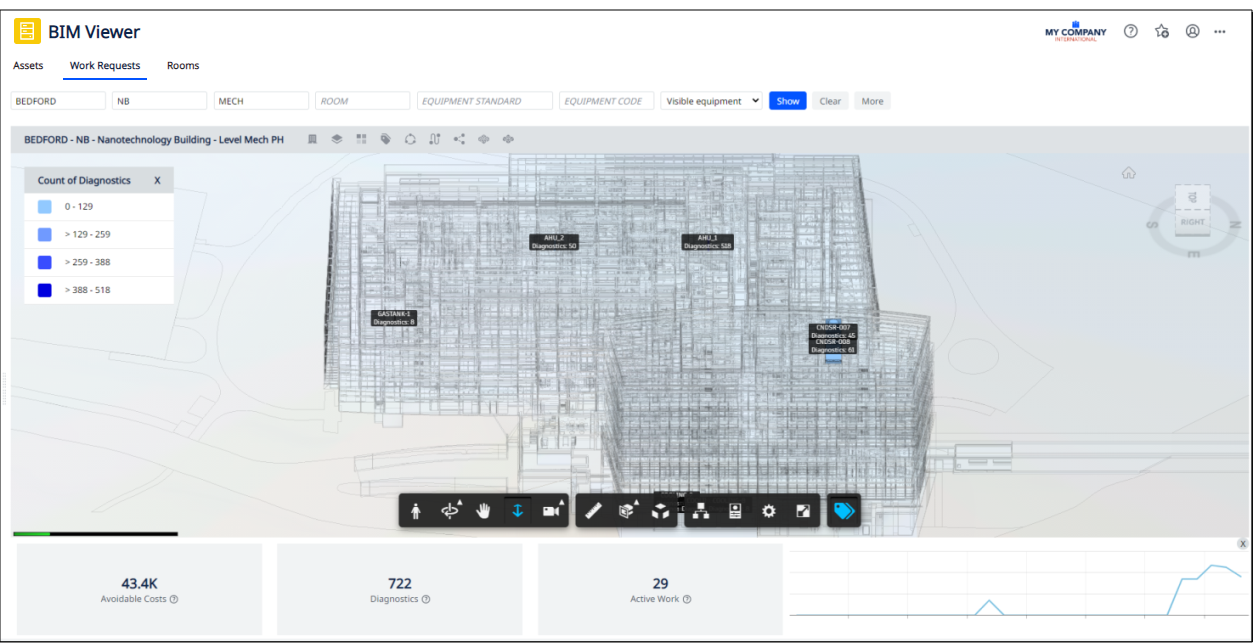
The highlights generate the following building-level statistics and list them beneath the model:
-
Avoidable Costs
SUM (cost_savings) FROM bms_eq_diagnostic WHERE (CURRENT DATE - date_start) <= 30 days AND eq_id is one of the eq in the building or floor (depending which one is selected)
-
Number of Diagnostics (in the Past 30 Days)
-
Number of Active Work Orders
COUNT(*) FROM bms_eq_diagnostic WHERE (CURRENT DATE - date_start) <= 30 days AND eq_id is one of the eq in the building or floor (depending which one is selected)
COUNT(wr.wr_id) FROM wr, bms_eq_diagnostic WHERE wr.wr_id = bms_eq_diagnostic.wr_id AND status NOT IN ('Rej','Can','Com', 'Clo') AND eq_id is one of the eq in the building or floor (depending which one is selected)
Diagnostics Highlight
Highlight equipment with diagnostics in the past 30 days. The highlight runs this query:
SELECT eq_id FROM bms_eq_diagnostic WHERE (CURRENT DATE - date_start) <= 30 days AND eq_id is one of the eq in the building
The highlight generates a count of diagnostics by Equipment Code.
COUNT(*) FROM bms_eq_diagnostic WHERE (CURRENT DATE - date_start) <= 30 days AND eq_id is one of the eq in the building AND eq_id = highlighted equipment
High Priority Diagnostics
Highlight equipment with high priority diagnostics that might have triggered a work request. The highlight runs this query:
SELECT eq_id FROM bms_eq_diagnostic WHERE (bms_priority_comf >= MAX( bms_analysis_config.priority_high_limit)
OR bms_priority_energy >= MAX(bms_analysis_config.priority_high_limit)
OR bms_priority_maint >= MAX(bms_analysis_config.priority_high_limit) )
AND eq_id is one of the eq in the building AND (CURRENT DATE - date_start) <= 30 days
The highlight generates a count of diagnostics with high priority for the equipment
COUNT(*) FROM bms_eq_diagnostic WHERE (bms_priority_comf >= MAX(bms_analysis_config.priority_high_limit)
OR bms_priority_energy >= MAX(bms_analysis_config.priority_high_limit)
OR bms_priority_maint >= MAX(bms_analysis_config.priority_high_limit) )
AND eq_id = highlighted equipment AND (CURRENT DATE - date_start) <= 30 days
Avoidable Costs (Past 30 Days) Highlight
The highlight indicates assets that have a cost savings, as recorded in the Cost Savings field of the bms_eq_diagnostics table.
SUM (cost_savings) FROM bms_eq_diagnostic
WHERE (CURRENT DATE - date_start) <= 30 days AND eq_id is one of the eq in the building or floor
(depending which one is selected)
Procedure
Use these highlights in conjunction with the above tools. For example, you might follow this sequence:
-
Move to the Work Requests tab.
-
From the Highlights menu, select the Diagnostics highlight.
-
The Viewer pane highlights assets for which diagnostics were run in the past 30 days. Select one of the highlighted assets.
-
In the upper portion of the panel, review the Diagnostics KPI. Click on the KPI to access in the Work tab work requests that were generated from diagnostics.
-
Move to the Diagnostics tab to review all diagnostics for this asset.