Archibus SaaS / Leases / Cost Reports
Real Property / Cost Administration / Cost Administrator
Lease Benchmarks Report
For comparing leases on an even basis, the Lease Benchmarks report presents a variety of key benchmarks such as:
-
Yearly Total Cost per Negotiated Rentable Area
-
Yearly Total Cost per Occupant
These benchmarks enable you to evaluate how expensive or profitable the space is and to compare leases on an even basis.
The report provides these benchmarks for each lease and also summarizes data for all leases in the report by providing the Average, Minimum, and Maximum for lease data. The Average, Minimum, and Maximum statistics enable you to compare a particular lease to the other leases included in the report.
This report includes:
- Benchmarks based on a lease's Area - Neg. Rentable that help you evaluate how profitable or expense the space is and to compare the lease to others.
- Benchmarks based on occupancy that help you evaluate the lease costs in relation to the number of people occupying the space.
This topic includes the following sections:
- Restricting and Viewing Report Data
- Lease Benchmarks Report Calculations
- Lease benchmark Report When Using the Archibus Enhanced Global Feature Set
Restricting and Viewing Report Data
The Lease Benchmarks report presents its information on the following tabs from which you can set a restriction and view report data
Filter
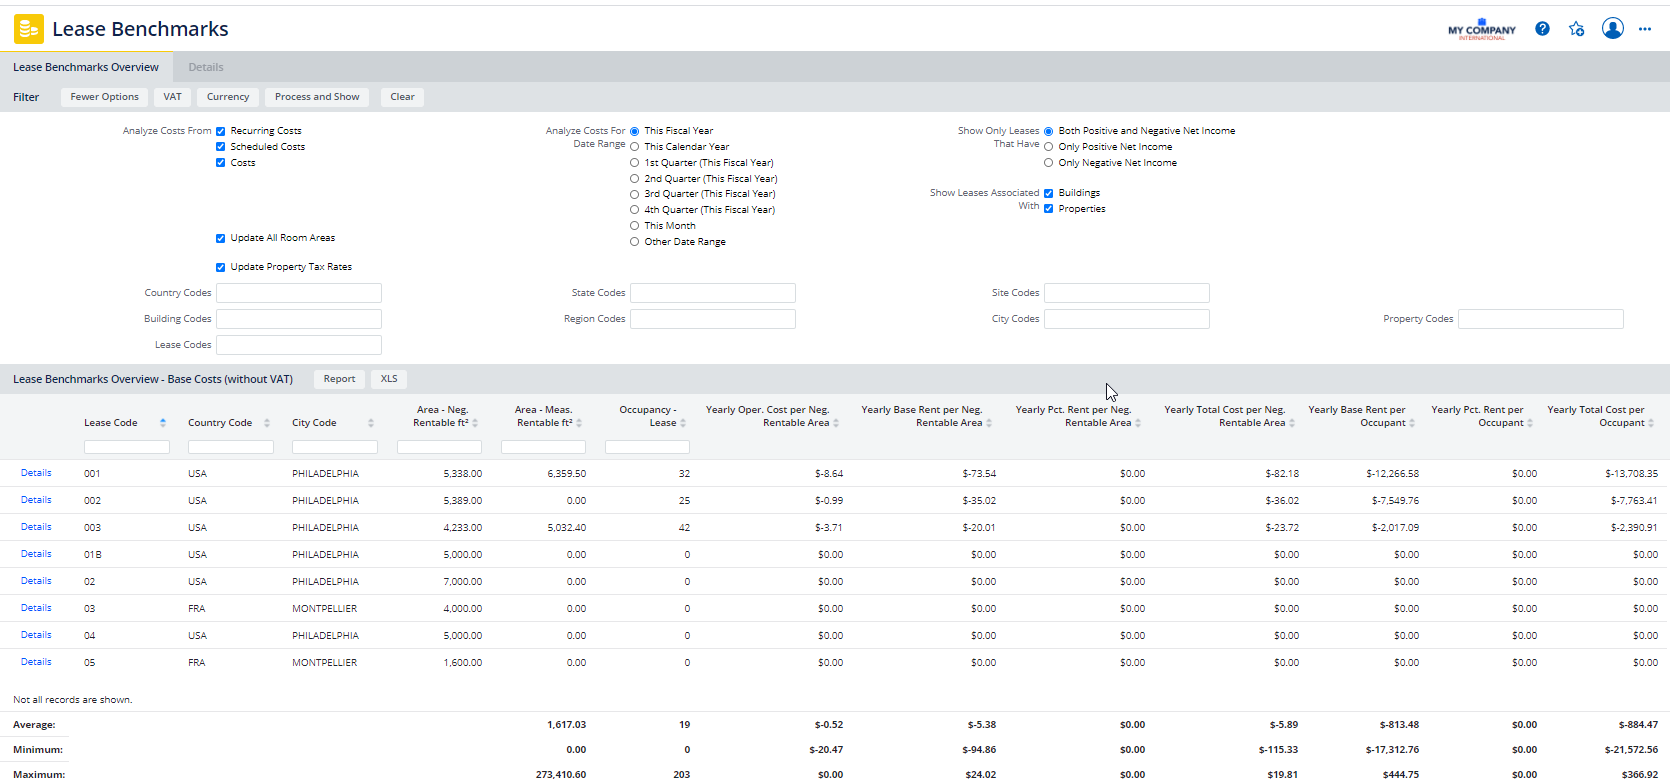
As shown in the above image, the Filter offers several options for determining the data of the Lease Benchmarks report. For example, using the Filter, you can specify the types of costs to examine (recurring, scheduled, actual, or a combination), as well as the time frame for which to analyze these costs and leases associated with buildings or properties. To set a custom date range, Select Other Date Range, and then enter a Start and End Date.
Once you set the filter, click Process and Show for the report to calculate data based on the filter and generate the report.
When reviewing the report, be sure to consider how the Filter console was completed. See Understanding Financial Analysis Reports for more information on how costs are selected.
Lease Benchmarks Overview tab
Once you set the filter options and process it, the Lease Benchmark Overview panel presents the lease data and calculations.
The report calculates the Average, Minimum, and Maximum for each benchmark, for the lease's negotiated area, and for lease occupancy. Having this information summarized enables you to compare a lease to the group of leases included in the report.
Note: When you export the report data to Excel, the Average, Minimum, and Maximum values are not exported. You can use Excel's features to calculate these values for the exported data.
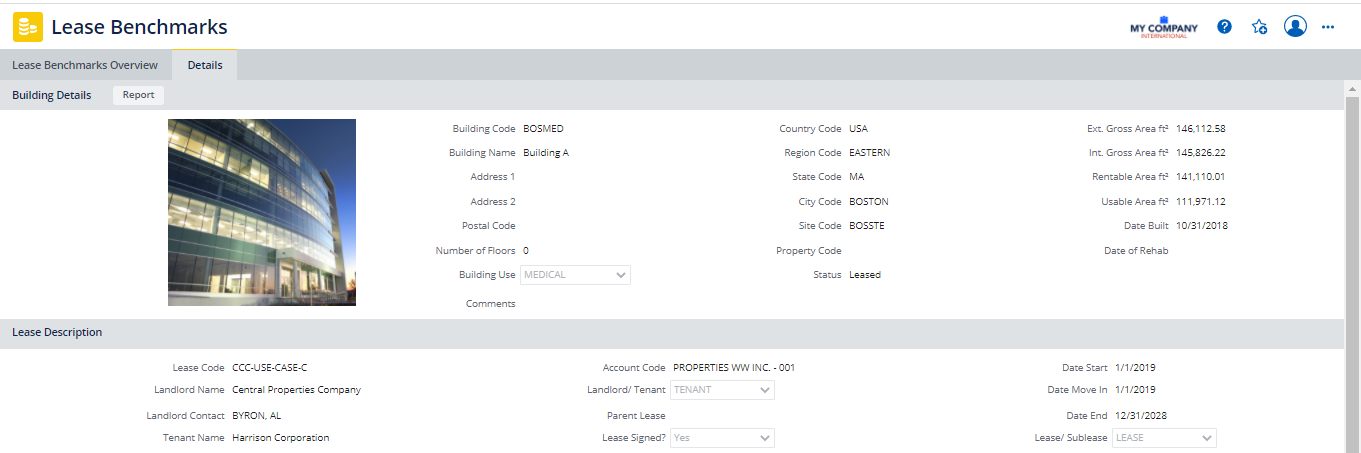
Details tab
Click the Details button for a lease on the Lease Benchmarks Overview tab, and the report presents the Details tab, which lists information for the building or property the selected lease is associated with, lease description, lease areas, lease costs, lease options, and contacts. You can toggle back to the Lease Benchmarks Overview tab as necessary.
Lease Benchmarks Report Calculations
The Lease Benchmarks report includes the following types of calculated fields:
- Building Rentable and Usable Areas that are based on a CAD building performance inventory. See Areas Based on a CAD Building Performance Inventory.
Note: The measured areas based on a building performance CAD inventory are calculated when the Update Area Totals action is run from one of the processes for the Space Inventory application or Space module, such as the Building Performance process. If your CAD specialist has made recent changes to your measured areas, ask your space manager or facility manager to run the Update Area Totals task so that these area changes are reflected in the reports of the Leases, Portfolio, and Costs applications. Additionally, some reports (such as Lease Abstract and Property Abstract) offer the Update All Room Area action (which runs these same calculations) from the report. For information on this action, see Update Room Areas.
- Lease negotiated areas that summarize the area that can be charged for. See Lease Negotiated Areas.
- Lease benchmarks that use yearly costs that are calculated for a period of 365 days, prorated using the costs that are within the Start Date and End Date period entered in the Filter Console. For example, if the Start Date and End Date cover a 3 month period, the program multiples the cost figures by 4 to get the yearly costs.
For a description of each benchmark, see Lease Benchmark Calculations.
Lease Benchmark Report When Using Archibus Enhanced Global Feature Set
When the Archibus Enhanced Global Feature Set is enabled, the Lease Benchmarks report by default shows Base Costs (without VAT) in the Budget Currency, providing an assessment of lease costs and benchmarks independent of taxes paid and received.
You can generate the Lease Benchmarks report to show Total Costs, Base Costs, or VAT Costs using the Budget Currency, your User Default Currency, or a currency you select. Generating the report using the Budget Currency enables you to assess unit costs per occupancy or negotiated area using your organization's currency. The Payment Currency enables you to assess performance in the local currency.
From the Currency button, if you choose the "Select Currency" option, you can chose to display the monetary values using either the Payment Exchange Rate or the Budget Exchange Rate for the currency you select.
Just as when the Archibus Enhanced Global Feature Set is not enabled, the Lease Benchmarks report calculates benchmarks to compare leases on an even basis. However, when the Archibus Enhanced Global Feature Set is enabled, the report calculates lease costs using Total Costs, Base Costs, or VAT Costs depending on the selections you make to generate the report. See Selecting VAT Cost Types and Currency for Reports for a description of the cost fields used to show VAT costs in different currencies.
Area fields are displayed in the User Display Units of Measure set in the User Profile for the logged on user.
Differences between Costs on the Overview tab and the Details tab
When you have enabled the Archibus Enhanced Global Feature Set, note the following differences between the costs shown on the Overview tab and on the Details tab of the Lease Benchmark, Property and Building Benchmark, Property/Building/Lease Abstract, or the Rent Roll reports:
| Issue | Description |
|---|---|
| VAT Cost types | The Overview tab shows costs using the VAT cost type you select. Using the VAT button, you can select to view Total Costs, VAT Only, or Base Costs. The Details tab always shows Total Costs, no matter what selections you make using the VAT button |
| Exchange rate type | When you first generate the report, for the Overview tab, the application converts costs from their payment currency to the display currency using the exchange rate type associated with the display currency (this can be either the payment or budget exchange rate type). The Details tab always shows costs using the budget exchange rate type, regardless of the exchange rate type selection made using the Currency button. For this reason, depending on your selections, different exchange rate types might have been used for the costs, and this can contribute to a difference between the costs shown on each tab |
| Effects of rounding | The costs shown on the Overview tab have been converted from their payment currency to the display currency. For the Details tab, the application uses costs already converted to the budget currency from their payment currency, and converts them to the display currency. Because costs on the Details tab have an extra conversion, the rounding of decimal places when applying conversion rates can impact costs on the Details tab more than costs on the Overview tab. |