Archibus SaaS / Leases / Cost Reports
Real Property / Costs / Cost Administrator
Cash Flow Report
The Cash Flow report summarizes your costs as net income by properties, buildings, leases, or accounts for the time period you select. The report provides monthly, quarterly, or yearly cost totals for all portfolio items included in the report, and totals for each portfolio item. The costs are summarized so that you can easily view them on one screen, a useful feature for large portfolios spanning multiple countries. You can then drill down in the summary to the Details tab that shows the break down of costs by cost category; from the cost categories, you can drill down to see all cost records for that category.
Use the Cash Flow report to analyze your costs for specific portfolio items and time periods. You can drill down to analyze any anomalies in the summarized data.
This topic includes the following sections:
- Filtering the Cash Flow Report
- Drilling Down to Analyze Cash Flow Details
- Cash Flow Report when Using Archibus Enhanced Global Feature Set
- How the Cash Flow Report Uses Lease Indexing Values
- Viewing Cash Flow Totals as a Chart
- Exporting the Cash Flow Data
Filtering the Cash Flow Report
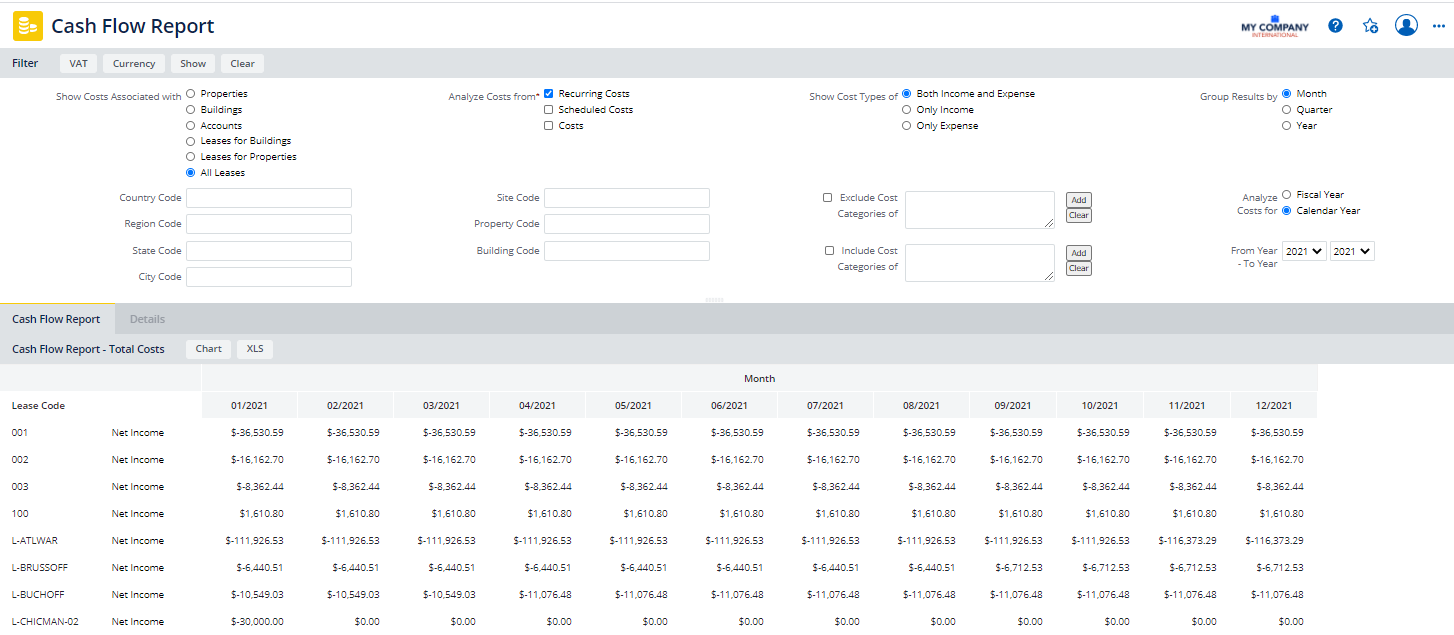
By default, the Cash Flow report Filter console is set up to generate the report for all Recurring Costs (both income and expenses) associated with leases, and summarized for the current year. You can generate this report by clicking Show. Use the Filter to enter a different restriction, such as working with actual costs or costs of a specified building. You can also include or exclude specific cost categories from the report.
For example, you can:
-
include a mixture of cost types (Recurring, Scheduled, or Actual costs) in the report; the program selects records in a way that ensures that costs are not duplicated. For more information, see Understanding Financial Analysis Reports.
-
generate the Cash Flow report by fiscal or calendar year by selecting the option button. Your administrator defines when your fiscal year starts. See Defining Fiscal Year.
-
enter future dates to estimate future costs
-
generate the Cash Flow report to summarize any of the following costs:
-
income only
-
expenses only
-
income and expenses. This selection generates net cost (income minus expenses) by cost category.
-
Drilling Down to Analyze Cash Flow Details
The Cash Flow report presents data in two tabs: the Cash Flow tab and the Details tab.
The Cash Flow tab presents data for each property, building, lease, or account in a single row. This row shows the portfolio item's costs grouped by the time period selected for the report (month, quarter, or year).
To analyze the cash flow data, on the Cash Flow tab, you can select the following fields to open the details in the Details tab. This will show the item's costs broken down by cost category and grouped by the report's time period
- the Property, Building, Lease, or Account Code
- any cost cell for the portfolio item.
When you select data on the Cash Flow tab, the report switches to the Details tab and presents the selected drill-down data.
From the Details tab, you can further analyze data by selecting the following. The cost records contributing to this data will appear in a pop-up window.:
- a cost category (or any cell in the row for the cost category) to review its cost records.
- a date in a column header to see all cost records for all cost categories for this time frame.
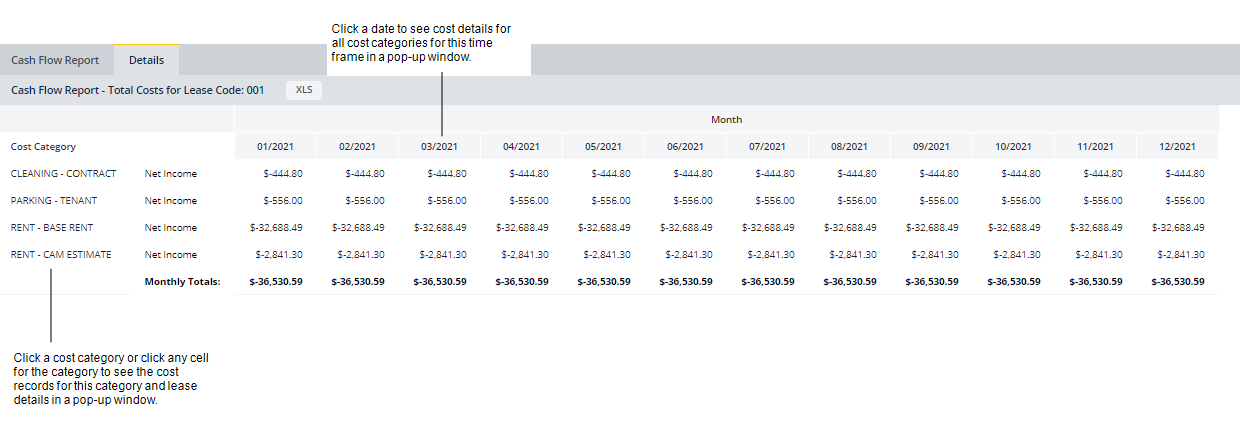
Drilling down from the Details presents lease and cost details in a pop-up window. You can export this data to PDF or to Excel.
Using Archibus Enhanced Global Feature Set
When you have enabled the Archibus Enhanced Global Feature Set, you can choose to generate the Cash Flow report to show Base Costs, Total Costs, or VAT Costs in the Budget Currency, your User Default Currency or a currency you select.
Just as when the Archibus Enhanced Global Feature Set is not enabled, the Cash Flow report summarizes costs as net income (income - expenses) value for each portfolio item (property, building, lease, or account). However, when the Archibus Enhanced Global Feature Set is enabled, the report shows this net amount as Total Costs, Base Costs, or VAT Costs depending on the selections you make to generate the report. See Selecting VAT Cost Types and Currency for Reports for a description of the cost fields used to show these VAT costs in different currencies.
When you drill down from the Details tab, the lease and cost details appear in a pop-up window. These lease costs show the breakdown for the cost record using the currency selected to generate the Cash Flow report.
You can view the following fields for each cost transaction:
Lease Indexing Values
After the indexing workflow rule has updated the Recurring Costs in the ‘RENT-BASE RENT’ category for a lease, the Cash Flow Report calculates the Net Income as follows:
- For present calculations or future projections, the application uses the updated Amount Income / Amount Expense of the new recurring costs using the RENT - BASE RENT cost category
- For past records (that is, the Year for the cash flow is before the current year), the application uses the already approved costs amounts in the RENT - BASE RENT cost category.
For more details on indexing calculations, see About Lease Indexing Calculations.
Viewing Cash Flow Totals as a Chart
You can generate the totals shown in the Cash Flow report as a chart by clicking Chart. The chart uses the same grouping (months, quarters, or years) as you selected for the report. The chart shows positive cash flow as green bars, and negative cash flow as red bars.
Exporting the Cash Flow Data
To export the Cash Flow report to Excel, click the XLS button at the top of the report.
To export the chart to a DOCX file, generate the Cash Flow report as a chart by clicking Chart at the top of the report. From the chart view, click DOC to generate the chart as a Word document, so that it can be shared offline.
See Also