Real Property / Portfolio
Buildings Dashboard
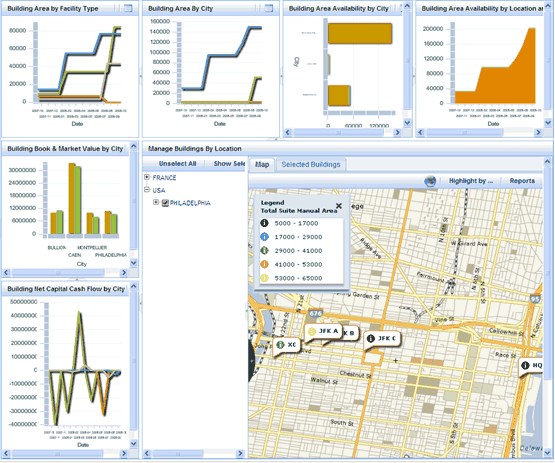
The Buildings Dashboard provides a comprehensive view of your buildings. This includes:
- Key performance indicator charts. By default, the Building Dashboard shows the following six key performance indicator charts. Your business process owner can customize the dashboard view to include charts with different groupings.
- Building Area by Facility Type
- Building Book Value & Market Value by City
- Building Net Capital Cash Flow by City
- Building Area by City
- Building Area by Availability by City
- Building Area Availability by Location & Time
- The Manage Buildings by Location view includes:
- A selection list to select and filter the buildings you want to work with.
- Selected Buildings view that provides summary statistics and details for selected buildings.
- Map view that provides tooltips, highlighted segments, and reports.
Note: If you are using the Archibus Enhanced Global Feature Set, the Portfolio cost fields are shown using your User Default Currency. These cost fields do not include the VAT amount, as these reports and charts are used for internal analysis for which VAT is not relevant. Area fields are shown using the User Display Unit of Measure field (Metric or Imperial) entered in your User Profile.
From the dashboard, you can maximize the view for a chart by clicking the Maximize button  . From the maximized view, you can filter the data shown in the chart, or generate the chart as a report. See Key Performance Indicator Chart Title Bar Icons.
The following shows the Buildings Dashboard with the Map view showing dynamic highlight segments:

See Also