System / Add-In Manager / Reports Central
Foundations / Background Data & Reports / Reports Central
Calculate Data in the Grid
You can have your report calculate selected numeric fields and display the calculation after the last record in the grid. If there are many records in the grid you have to scroll to see the calculation.
You can:
-
sum
-
average
-
list the lowest value (Minimum)
-
list the highest value (Maximum)
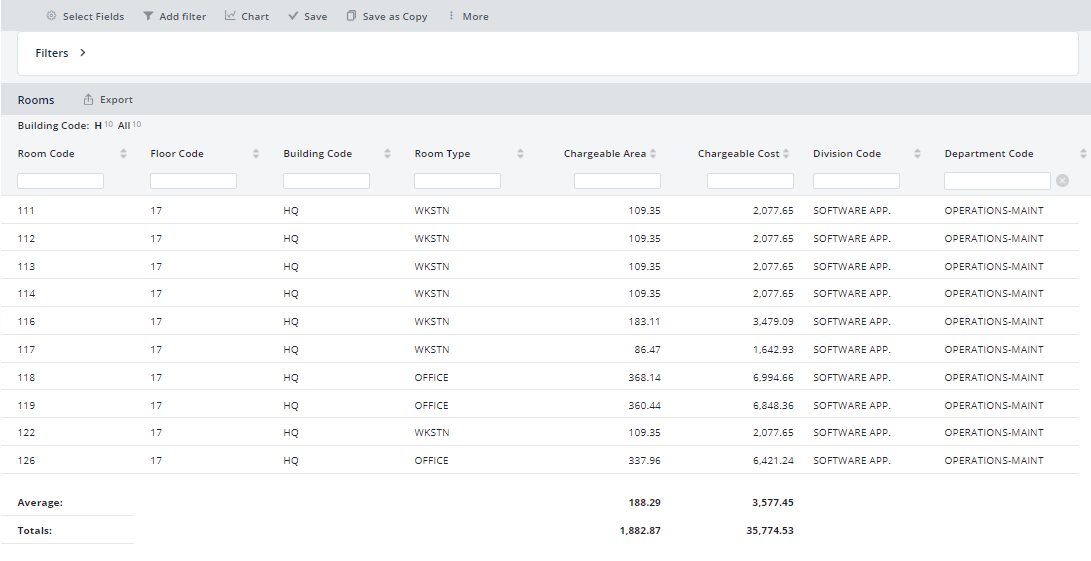
For example, the below report provides a total and average for two numeric fields.
Procedure
-
Click Select Fields.
-
In the Select Fields form, click the Display Settings tab.
-
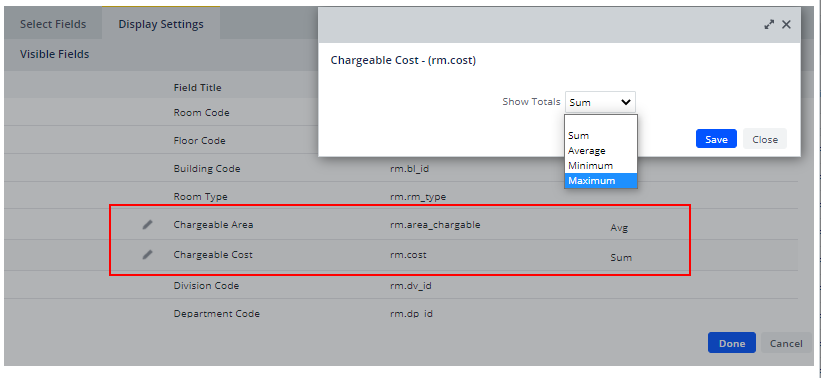
In the Display Settings tab, each numerical field (number with decimals or integer) in your report offers the Edit (pencil) icon. Select the Edit icon for the field you wish to calculate.
-
In the pop-up from, complete the Show Totals option the calculation for the field. Available options are: SUM, AVERAGE, MIN, MAX. Note that COUNT is not available for the grid, although it is available when working with charts.
-
Save and return to the Display Settings form. Notice that the form displays the calculation method you selected for the field as a reminder.
-
Scroll the grid to see that it displays your calculation at the bottom of the grid.
-
Select another field to calculate and follow above procedure. If you choose to calculate more than one field and choose different calculations for each column (for example. Average and Sum), the two calculations will appear on different lines marked as Average and Total.
Note that the system applies the calculation to all numeric fields you have chosen to calculate. For example, in the above image, the user chose Sum for Chargeable Cost and Average for Chargeable Area. The resulting report (shown at the top of the topic) calculates the Sum and Average for both of these fields.
Understanding Numeric Fields
In order to calculate data, the report must have visible a field that is a number (integer or with decimals) and is defined with these properties in the Archibus Fields (afm_flds) schema table. This also applies to adding charts to a report.
-
Archibus Type
-
None
-
Area
-
Len (Length)
-
Std. Area
-
Currency
-
Calculated
-
-
Numeric Format
-
Default
-
Budget Currency
-
Area
-
Length
-
Payment Currency
-