Space / Space Inventory / Space Manager (Transactional)
Space / Occupancy/ Space Manager (Transactional)
Allocation, Trends, and Benchmarks Report
Space managers must often align space use with operational initiatives, such as amount of meeting room space in a usable area, or the percent of space that is hotelable. In addition, space managers must be able to analyze previous trends in space use in order to better inform future space-related decisions, and identify improvements in space efficiency and use.
To accommodate those needs, the Allocation, Trends, and Benchmarks report enables the space manager to see how all space is divided among various attributes such as categories, departments, and occupancy, see trends over time, and compare actual use to benchmarks.
This report supports the following use cases:
- The relative space taken by conference rooms versus offices
- The relative space taken by offices versus hotelable space
- The relative space taken by selected departments in a building or site
- The relative space taken by fully occupied, vacant, available, and over-occupied rooms
- The relative space taken by department area versus common area.
- The relative space taken by usable area, service area, and vertical penetration area. This helps put into context the building performance statistics.
- The trends of space allocation over time
- The amount of space, of certain types, compared to pre-defined benchmark values.
The task provides three tabs: Allocations, Trends, Benchmarks. For each tab, you specify the options that you want that tab to report on.
Setting the Filter
Each tab presents a number of filter options so that you can control which data the report uses to generate the bar graph.
| Option | Description |
|---|---|
| Dates | You can choose a single date range and then use the directional arrow to move to past and future dates. Or, you can report on data for a date range; the system reminds you of the date range for which you last ran Update Area Totals. For more information on working with single dates and date ranges, see Calculating Data: Generating Snapshot or an Historic Average |
| X-axis/Y-axis | Choose the data that you want to display on each axis of the bar graph. The options vary between tabs, but you can choose between room area and room count for one axis, and values such as floor, building, site, room category, on the other axis. The Trends tab offers various time periods, such as quarter, monthly. |
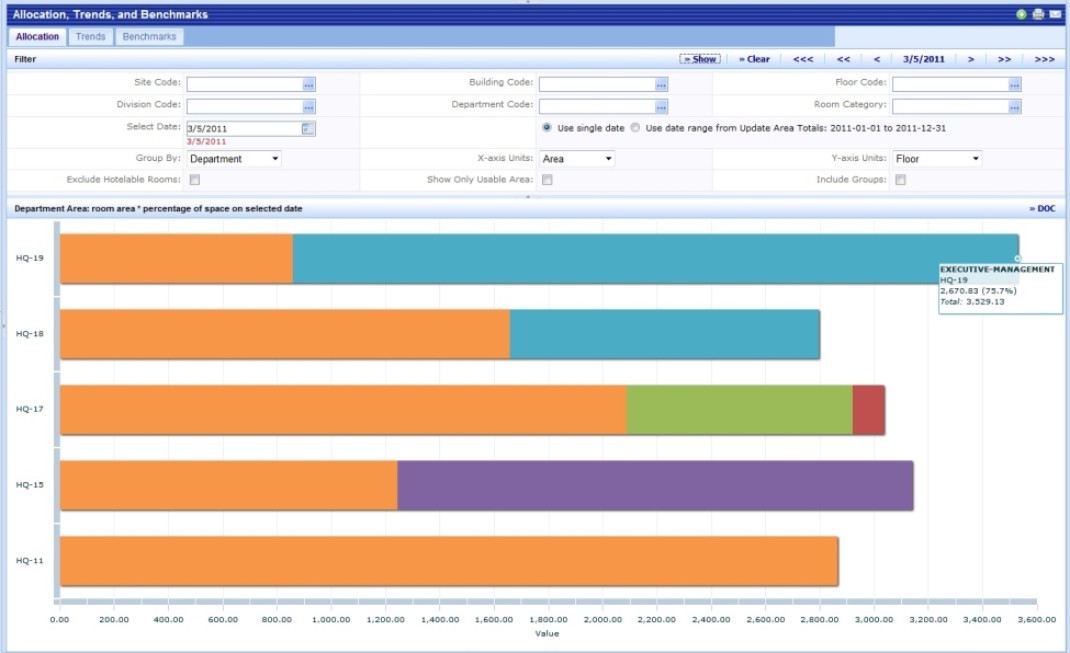
| Group By | For the bars in the graph, you can choose the data that the bars will report on. For example, if you report on area (X-axis) for each floor (Y-axis) and floor HQ-17 is occupied by three divisions, the bar for this floor will be proportionately divided into three sections according to the values for Division; you can then hover over each section in the bar to determine the value that this section represents. The below image shows this configuration. |
| Groups | If you have a mixed inventory that includes both rooms and groups, you can choose to omit or include groups in your report. Workspace Transactions apply only to rooms, so if you choose to include groups you will not be able to see future and past space usage, which is based on workspace transactions |
| Hotelable Rooms | You can choose to omit or include hotelable rooms from the report |
For example, in the below image, the filter has been set to report on room area (x-axis) for each floor (y-axis) and that each floor's area bar should be proportionately colored to reflect the department assignment. Hovering over the blue portion of the bar for floor HQ-19 shows that the blue bar represents the Executive-Management department.
Note: If you click the Show button without having changed any filter criteria, the same report will be generated in a new tab.
Allocations Tab
The Allocations tab reports on how area is distributed to among various criteria (the value that you specify in the Group By option). By visually examining the length of each bar, you can see how the overall area size varies between floors. This is also known as a stack plan.
Use the colored sections of each bar to determine how area within a floor is allocated to specific departments, divisions or room categories (depending on the Group By option). Note that if you choose "All Area Types" for Group By, the bar will indicate all types of areas: vertical penetrations, service areas, and departmental areas.
Trends Tab
Use the Trends tab to see how allocation changes over time. You can select a time period (month, quarter, year) as well as the years for your date range. Use the Trends tab to see trends in how division area, department area, and occupancy rates change. These values are calculated and stored monthly using the Trending Metrics features. the afm_metric_trend_values table stores these results:
- department_area x month, x quarter, x year
- occupancy_count x bl x month, x quarter, x year
- em_capactiy x bl x month
For example, to generate the occupancy rate for Q2 in 2011 for building HQ, the system:
- gets occupancy_count x bl x quarter for HQ with a metric date of 2011-06-30
- gets em_capacity x bl x month for HQ, metric date of 2011-06-30
- divides occupancy by capacity
Capacity is a snapshot at the end of the time period. By storing capacity as a trend metric, the system allows it to change. In calculations of other occupancy in other reports, capacity comes from the values in the Rooms table.
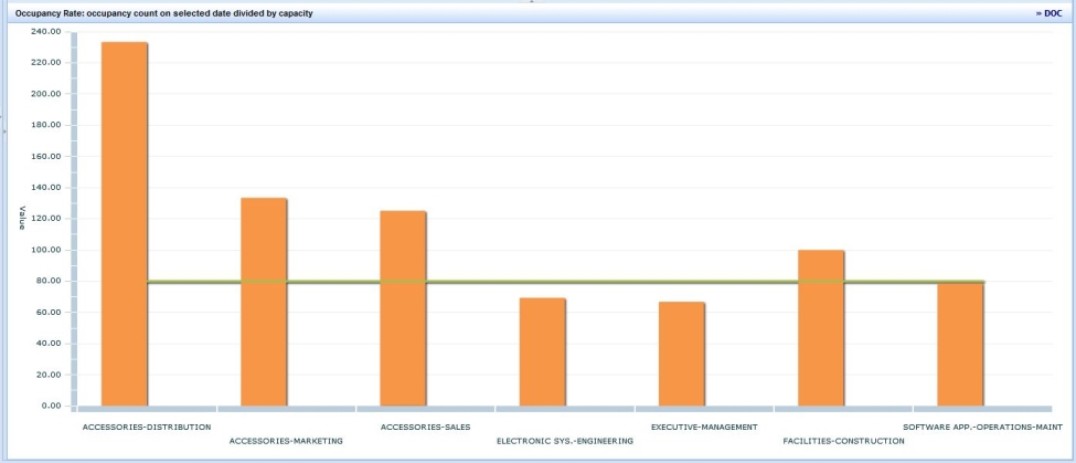
Benchmarks Tab
If a benchmark value exists for the selected Group By option , then the view shows that benchmark value as a horizontal line on the bar chart control, for example, the green line in the below image. Valid benchmark values for this report are as follows. These benchmark values are set with Define Space Application Parameters.
OccupancyRate: if the user selects Group By of Occupancy RateAverageAreaPerOccupant: if you selects Group By of Average Area per Occupant
Use the benchmark to compare your current conditions with your goal.
With metrics such as area, cost, occupancy, and benchmark area per occupant, organizations may identify and quantify opportunities for cost improvement. Here is an example:
- The difference between actual area per occupant and benchmark area per occupant can be multiplied by the cost per area to get the extra cost per occupant that the organization spends because occupants take more space than desired. Multiply the cost per occupant by the total number of occupants, and you get a total cost improvement opportunity.
Another way of looking at this is:
- Divide the area by the benchmark area per occupant to get a target occupancy for a location. Put the target occupancy into the total cost to get a cost per target occupant. The difference between the target occupancy and the actual occupancy, multiplied by the cost per target occupant gives the same cost improvement opportunity.