Real Property / Portfolio / Structures
Structures Dashboard
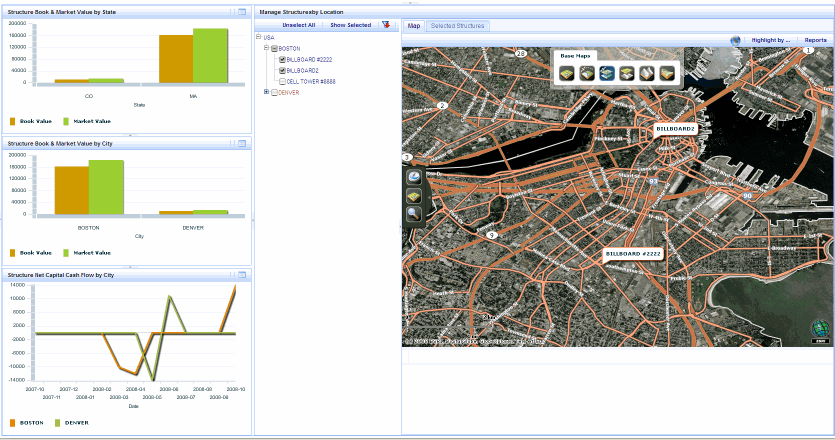
The Real Property / Portfolio / Structures / Structures Dashboard includes:
- Key performance indicator charts. By default, the Structures Dashboard shows the following key performance indicator charts. Your business process owner can customize the dashboard view to include charts with different groupings.
- Structure Book Value & Market Value by State
- Structure Book Value & Market Value by City
- Structure Net Capital Cash Flow by City
- A selection tree to select and filter the structures you want to work with. You select items to place them on the map, or to view summary statistics for them in the Selected Structures view,
- Selected Structure view
- Map view
Note: If you are using the Archibus Enhanced Global Feature Set, the Value - Book, Value - Market, and Net Capital Cash Flow cost fields are shown using your User Default Currency. Area fields use the User Display Unit of Measure field (Metric or Imperial) entered in your User Profile.
From the dashboard, you can maximize the view for a chart by clicking the Maximize button  . From the maximized view, you can filter the data shown in the chart, or generate the chart as a report. See Key Performance Indicator Chart Title Bar Icons
The following image shows the Structures dashboard with the Map view selected:

See Also