Technologies / Innovative Solutions / Integrations - IoT
IoT Utilization Report
Note:The sample HQ database has sensor data covering the period 6/19/2023 through 6/22/2023. In order to explore this report, you can enter in the filter a time frame incorporating these dates.
Space managers analyze the sensor-generated data using the Technologies / Innovative Solutions / Integrations - IoT / IoT Utilization report (ab-iot-sp-analysis.axvw). From this report, you can:
-
report on the actual, physical utilization of space
-
highlight the floor plan to show utilization by room type and category, as well as by the room's assigned department and division
-
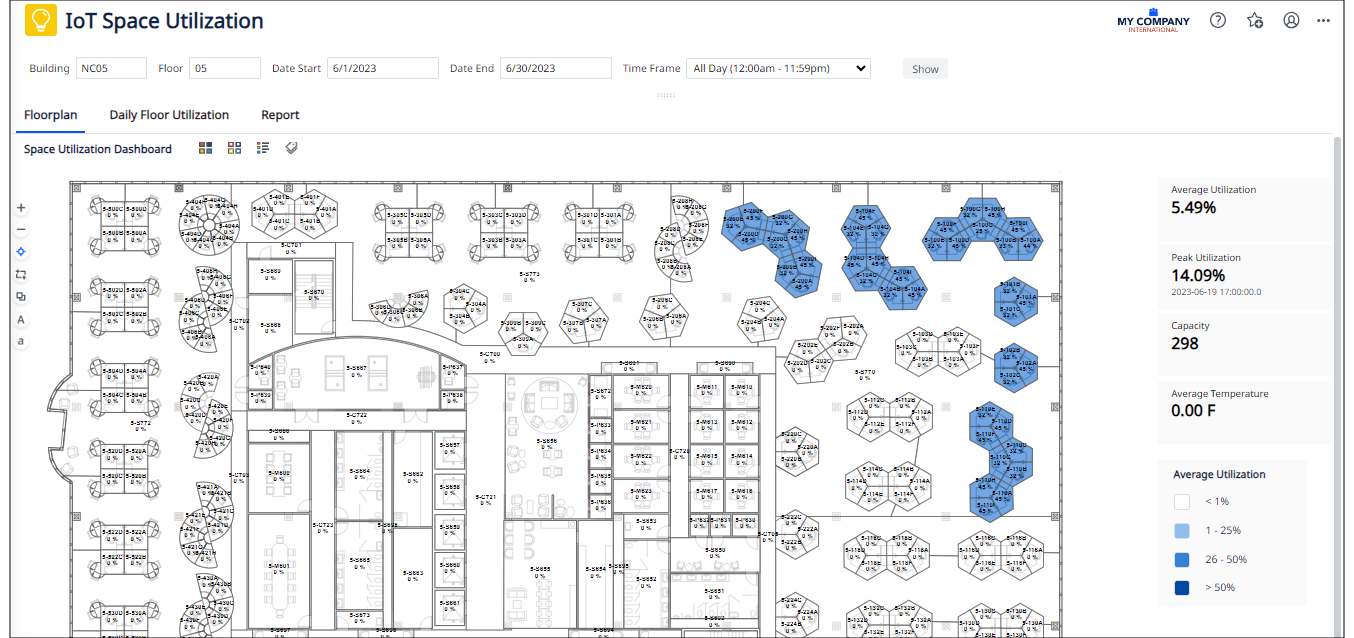
view a “heat map” of rooms by their average utilization percentage, for a date and time range
-
track room-by-room average and peak utilization metrics
-
key space utilization metrics per floor and then dig into the per-room data
-
analyze the utilization of a floor based on data that the Vergsense sensors record, providing insight into how rooms are utilized for a date and time range.

Setting the Filter
If you leave Date Start filter open, the report shows the past records for the month of the Date End. For example, if Date End is set to 6/19, then the report will return data for all dates between 6/1 and 6/19, granted that there is utilization data for those dates.
If you leave both Date Start and Date End filters open then the report displays the past 30 days of the current month. For example, if today is 7/3, then the report will return data for 7/1 , 7/2, and 7/3, granted that there is utilization data for those dates.
Calculations
The report makes the following calculations:
| Metric | Description | Calculation |
|---|---|---|
| Room Average Utilization | Average utilization for each room, for the filtered date and time interval | AVG(iot_space_util.avg_pct_util) for bl_id, fl_id, rm_id and date-time interval |
| Floor Average Utilization | The average utilization for the entire floor, for the filtered date and time interval |
Calculate RoomUtilization: For each room on the floor calculate AVG(iot_space_util.avg_pct_util) for the date-time interval Average Utilization = SUM(RoomUtilization*rm.cap_em) for all rooms on the floor / SUM(rm.cap_em) for all rooms on the floor) |
| Room Peak Utilization | Maximum Utilization for the each room, for the filtered date and time interval | MAX(iot_space_util.max_pct_util) for bl_id, fl_id, rm_id and date-time interval |
| Floor Peak Utilization | Maximum Utilization for the entire floor together with the date when the maximum utilization was achieved, for the filtered date and time interval |
Restricted to the floor code. Step 1) Group records by date_start, time_start . MaxCountEm = For every date_start+time_start (every hour) in the date-time range SUM(iot_space_util.max_count_em) for all rooms on the floor Step 2) Calculate MAX(MaxCountEm) / SUM(rm.cap_em) for all rooms on the floor For the date+time value display iot_space_util.date_start+time_start for MaxCountEm. If more then 1 date_start+time_start exist, then display the first one (oldest), |
Tabs
The IoT Utilization report as three tabs:
| Tab | Description |
|---|---|
| Floor Plan |
This tab opens by default and displays a floor plan that highlights the rooms for which average utilization sensor data is available. Use the key on the right to understand the utilization rate represented by each color. The Floor Plan tab includes commands for displaying room labels, accessing the legend, and highlighting the floor plan by different factors (the Highlights and Border Highlights commands). For example, you might want to highlight rooms by utilization and then use a border highlight of divisions so that you can visualize the utilization rate for each department. See Working with a Floor Plan. |
| Daily Floor Utilization |
Presents a column chart showing Average Count of Persons and Peak Person Count for each day.
The column chart can be zoomed. This is handy if you pick a larger date range, and need to zoom in to a particular time period. |
| Report |
If you need to dig into the data shown on the floor plan or the column chart, use the Reports tab, which lists each room and its utilization data. Use the tab's Fields command to display additional fields from the Rooms table. You can also export this data to XLS. |