System / Add-In Manager / Define Analysis Metrics
Smart Client - Real Property / Strategic Financial Analysis / Financial Analysis (SC) - Smart Client
Define Analysis Metrics
The Strategic Financial Analysis application comes with analysis metrics. Deployments that wish to add their own analysis metrics, or adjust the definitions of existing metrics, must purchase the Archibus Performance Metrics Framework separately, and can then use the Define Analysis Metrics task to make the adjustments.
Besides using the Define Analysis Metrics task to edit or add new metrics, you can use this task to review the definitions for the analysis metrics that the application provides out-of-the-box. The Metric Description and Business Implications provide information on how the metric is calculated and used.
Analysis metrics calculate strategic analysis values. Like tracking metrics, analysis metrics are defined in the Metrics Definitions table (afm_metric_definitions) and can have trending directions and warning levels. However, unlike tracking metrics, analysis metrics:
- are intended for strategic analysis and are typically on a yearly granularity, or they forecast multi-year conditions, such as 3-Year NPV or lifetime IRR
- can include both past performance, such as actual energy consumption, and future values, such as estimated energy consumption for future years
- are not displayed on home pages, but are displayed by a view, which can provide interactive filtering.
- are not processed by the Metrics workflow rule, and their values are not saved to the Archibus Metric Trend Values (afm_metric_trend_values) table. Analysis metrics are updated using the Update Analysis Metrics action accessed from the Aggregate and Forecast Costs for... tasks available from the Strategic Financial Analysis application. This action, in turn, invokes logic for calculating ratio metrics, or for invoking Java beans that perform analyses that involve calculation.
Where the application displays analysis metrics
The Strategic Financial Analysis application's Financial Analysis Console, and the Assets domain's Asset Lifecycle Console (Optimization tab) display analysis metrics. The following sections of the Financial Analysis Console use the Metrics Definitions table (afm_metric_definitions) to determine how to display the cost analysis values:
- Capital and Expense Matrix
- Asset Map
- Analysis Scorecard panel
- Asset Scorecard panel
Procedure: Defining analysis metrics
As the add-in manager, you can define analysis metrics for your deployment, as long as you have purchased the Performance Metrics Framework.
To define analysis metrics:
- Select the Define Analysis Metrics task from these locations:
- From Web Central, select System / Add-In Manager / Define Analysis Metrics.
- From the Smart Client, select Real Property / Strategic Financial Analysis / Financial Analysis / Define Analysis Metrics task (under the Add-In Manager heading.)
The Define Analysis Metrics form appears. The Analysis Metrics panel shows all the metrics that have already been defined
- To add a new metric, click Add New .
The Analysis Metric Definition form appears.
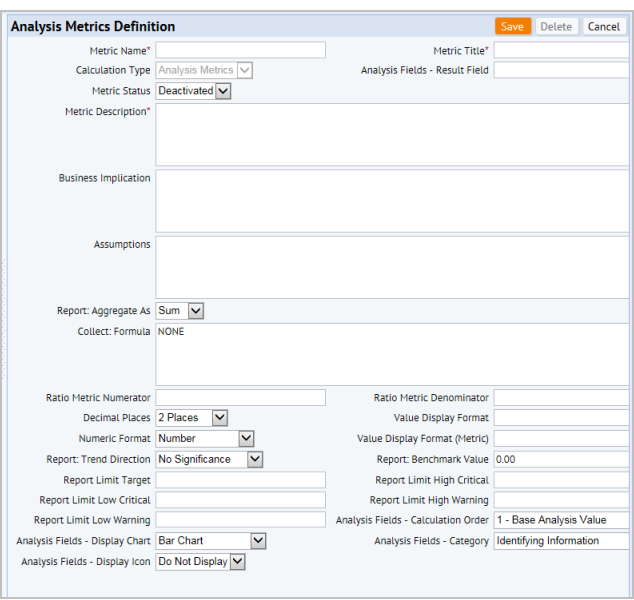
- Enter the following required information for the metric:
Field Field Name Description Examples Metric Name metric_name A unique name for the metric.
Use this field to enter the corresponding table name and fields name from the finanal_sum and finanal_sum_life tables using the following convention:.
table_name.field_name
Where:
table_name is either finanal_sum or finanal_sum_life
field_name is one of the columns in those two tables.
finanal_sum.leased_owned_percent
finanal_sum.total_occupancy_cost_perSeat
Metric Title metric_title A relevant title describing the metric. The title identifies the metric to those working with the metric in the Financial Analysis Console. Leased / Owned (%)
Total Net Worth
Total Occupancy Cost per Seat
Total Ownership Cost per Area
Metric Description description Detailed business description of the metric, containing the purpose of the metric and information helpful for understanding the metric’s calculation.
This field is not shown in the Financial Analysis Console.
For example, IRR (3 yr.) might be described as "The internal rate of return for the asset, given all expenses and income over the first three years or the entire lifetime."
- Enter the following information as needed:
Field Heading Field Name Description Example / Comments Calculation Type (afm_metric_definitions.calc_type) All analysis metrics created through this view are of calc_type = 'Analysis Metrics. This distinguishes these metrics from tracking metrics.
The analysis fields used in the Financial Analysis Console, will be set to calc_type = 'A' (Analysis Fields). Analysis Fields - Result Field afm_metric_definitions.analysis_result_field The field that stores the results of this analysis metric. Used by the Update Analysis Metrics action. Metric Status. metric_status The Update Analysis Metrics action processes only analysis metrics that have a Metric Status of 'Active.'
When defining a new metric, set the status to Active when you are ready to include the metric in calculations.
If you do not want to use a metric, set its Status to Deactivated.
Business Implication biz_implication The business import of the metric. This text states what the metric means and what actions managers might take based on that metric's information.
This field is not displayed in the Financial Analysis Console
For instance, the implication for "IRR (3 yr.) " might be:
"The internal rate of return for the asset, given all expenses and income over the first three years or the entire lifetime.
IRR (3 Year) presents return for the second year.
IRR (Lifetime) presents return over the Planned Life of the asset."
Assumptions. assumptions Describe any requirements for using this metric accurately.
This field is not displayed in the Financial Analysis Console
For example, for the IRR (3 Year) metric, the assumption is "You must have at least one positive and one negative cash flow year for the asset to calculate the rate of return."
Report: Aggregate As report_aggregate_as Determines how to aggregate this column for datasources that:
- SUM- sums all fields that are an absolute value (e.g. Number of Seats)
- AVG:
- averages all fields that are a percentage (e.g. Leased/Owned percent)
- averages all fields that are a metric (e.g. Cost per Seat)
- NONE for non-numeric fields.
Collect: Formula collect_formula Supply a WFR (workflow rule) (bean) name for any analysis metric that is not a ratio metric.
WFR (workflow rule) names need to be prefixed with "bean:"
The formula the metrics rule should use to calculate this metric's values. Please see the discussion Collect: Formula below.
Note: To use Java Classes as workflow rules, declare them as beans.
Ratio Metric Numerator ratio_metric_num Specifies the numerator metric in a ratio metric. For example, cap_AnnualWorth_an_fy for the Annual Worth metric. If you specify a Ratio Metric Numerator, you must also specify a Ratio Metric Denominator.
Ratio Metric Denominator ratio_metric_denom Metric that is the denominator ( in a ratio metric. For example, spac_bl_AreaInternalGross_an for the Annual Worth metric Decimal Places value_disp_decimals This field specifies the rounding that the display controls should perform on values when displaying them.
For instance, you can display "10,000,000.12" with the following rounding values:
- “2 Places” -- 10,000,000.12
- “1 Place” -- 10,000,000.1
- “0 Places” -- 10,000,000.
"Hundreds" -- 100,000H
- “Thousands” -- 10,000K
- “Millions” -- 10M
"Billions" (i.e. "thousand-millions") -- 0.01G
Value Display Format
value_disp_format This is a template pattern formatting the display value. See the discussion on Display Format below. Value Display Format (Metric) value_disp_format_m This is the template pattern the program uses for formatting the display value if your project database has metric Base-Area Units. Numeric Format value_disp_numeric All metric values are of Numeric data type. This field indicate how the metrics display controls should display the metric values.
For example:
- Number -- as they are (e.g. 100,000.12)
- Percentage -- multiplied by 100 (e.g. 23%)
- Base-Unit Area -- converted from the stored value in the Base-Area Units of the project (e.g. sqM) to the user-display area units (e.g. sqM or sqft depending on the user's locale)
- Organizational Budget Currency -- converted from the common budget currency (as defined in the AbCommonResources-Budget Currency application parameter) to the user-display currency (e.g. dollars or euros based on the user's locale).
Report: Trend Direction report_trend_dir This attribute is used for trend direction interpretation, which specifies whether an increase in this metric’s values from the last time period represents a positive or negative outcome for the organization.
Possible selections are:
- Smaller is Better
- Larger is Better
- On Target is Better
- No Significance
When displaying stoplight colors, the Report: Trend Direction indicates whether the program compares against the "high" limits (when "Smaller is Better", the "low" limits (when "Larger is better") or both ("On Target" is better).
For more information, see Archibus Administrator / Define Performance Metrics / Types of Metrics in System Management Help.
Report Benchmark Value report_benchmark_value Use this field to record any industry benchmark value, against which the organization can compare its performance. For example, for the IRR (3 Year), a benchmark value could be '0.25" Report Limit Target report_limit_target The current performance target value for the organization. For example, for the IRR (3 Year) metric, the limit target could be 0.12 Report Limit High Critical and
Report Limit High Warning
report_limit_high_crit
and
report_limit_high_warn
High critical (red) and warning (yellow) levels for the metric. For example, for the IRR (3 Year) metric, the High Critical level could be 0.25,
and the High Warning Limit could be 0.20.
Report Limit Low Critical and
Report Limit Low Warning
report_limit_low_crit report_limit_low_warn Low critical (red) and warning (yellow) levels for the metric For example, for the IRR (3 Year) metric, the Low Critical level could be 0.07,
and the Low Warning Limit could be 0.09.
Analysis Fields - Calculation Order afm_metric_definitions.analysis_calc_order The order in which the program should calculate analysis results, so that base metrics are calculated before the other metrics that depend on them.
This field is an enumerated list with possible values of:
0;0 - Lifecycle Analysis Base Value;1;1 - Base Analysis Value;2;2 - Sum of Analysis Metrics;3;3 - Ratio of Analysis Metrics;
Analysis Fields - Display Chart afm_metric_definitions.analysis_display_chart The type chart used to display the analysis field's values in the Performance Matrix panel of the Financial Analysis Console.
This field is an enumerated list with possible values o:
DONUT;Donut;
PIE;Pie Chart;
PIEPCT;Pie Chart - Percent;
BAR;Bar Chart;
BARPCT;Bar Chart - Percent
Analysis Fields - Display Icon afm_metric_definitions.analysis_display_icon The icon to use as a semi-opaque "watermark" behind any bar chart:
Icons must be in the schema\ab-core\graphics\icons\analysis folder.
This fields is an enumerated list with possible values of:
N;Do Not Display;C;Currency Icon; B;Building Icon;P;People Icon
Analysis Fields - Category afm_metric_definitions.analysis_field_cat The grouping of the analysis value by business scope. This field is an enumerated list with possible values of:
INFO;Identifying Information;BLDG;Building;CAP;Capital;
OPER;Operating;LEAS;Lease;BENCH;Benchmark Cost Categories;OCCUP;Occupancy;SPAC;Space;ANLYS;Financial Analysis;FIN;Financing
- Click Save.
Display Format
This format pattern controls how the program displays metric values. The display format is important for clarity, as the units for metrics change from row to row in a scorecard display.
Wherever possible, use the Decimal Places and Numeric Format settings to control the output format and units, as these round values, convert currencies, and convert areas automatically. For instance, you can accomplish the formatting below without specifying a Display Format.
- 45,032M
- 34%
- 250.0 sqft --or-- 23.2 sqM
- $5,000 K --or-- €3,748 K
Use the Display Format when the metric value is not a standard value or when the metric value is a ratio, and the relationship between the original values and the display units is a function of the metric definition and not the original values. To do so, use a replaceable parameter "{0}" for the value and write the units as you want them to appear. For instance, if you have a Display Format of "{0} hrs" the program will display values like "1.5 hrs".
Use Display Format and Display Format (Metric) if you have a ratio with area as a denominator. For instance, take OpEx per Rentable Area. The metric value is in the budget currency, but the metric itself is divided by the Rentable Area, which is defined by your project base-area units as square feet or square meters, making the denominator either "RSF" (rentable square feet) or "RSM" (rentable square meters). The program will convert the budget currency, but use the format you specify for the denominator.
| Project Units are: | Base-Unit Area is sqFt | Base-Unit Area is sqM |
| Program Uses | Display Format | Display Format (Metric) |
| The Format specified is: | {0}/RSF | {0}/RSM |
| Typical output values (numerator is converted to user's display currency): | $1.21/RSF | €0.29/RSM |
(The denominator stays in the Base-Unit Area regardless of the user's locale, as the Base-Unit Area is a function of the project database, not of the user.)
Collect: Formula
This value defines the formula the metric rule uses in its calculation.
Leave this blank for ratio metrics. The Update Analysis Metrics calculation will automatically calculate the ratio and guard against denominators that are zero.
For metrics that calculate values, specify a bean name.
- Use
bean:bean_namewhen the metric rule should delegate to a workflow rule (for example,bean: CashFlowForecast). - Add your bean name to the bean definition file (schema\ab-products\common\resources\financialMetrics-definition.xml.) See \schema\ab-products\common\resources\src\test\com\archibus\app\common\finanal\ for the list of definition files.
For examples of analysis metrics beans, see \schema\ab-products\common\resources\src\main\com\archibus\app\common\finanal\metrics\.
For information on extending Archibus with Java, see System Management Help.
Analysis Fields - Result Field
Note that the result field in the Financial Analysis Summary (finanal_sum) or Financial Analysis Summary (finanal_sum_life) table must exist in the table. Use Add Field action to add this if it is a new result field.