Getting Results with Archibus
Portfolio
Your facility areas, whether you own, lease, or sublease them, represent one of your organization's most significant and expensive assets, and therefore one that it is important to track and analyze. The Portfolio application includes a wizard interface to facilitate entering data for your buildings, structures, and land so that you can track each of these portfolio items separately. It uses dashboards, key performance indicator charts, and geospatially-enabled map views to show how much area you have in each of your locations, how this area is used, its availability, and what the associated costs are. Having this information clearly and concisely presented enhances your ability to analyze your real property portfolio needs.
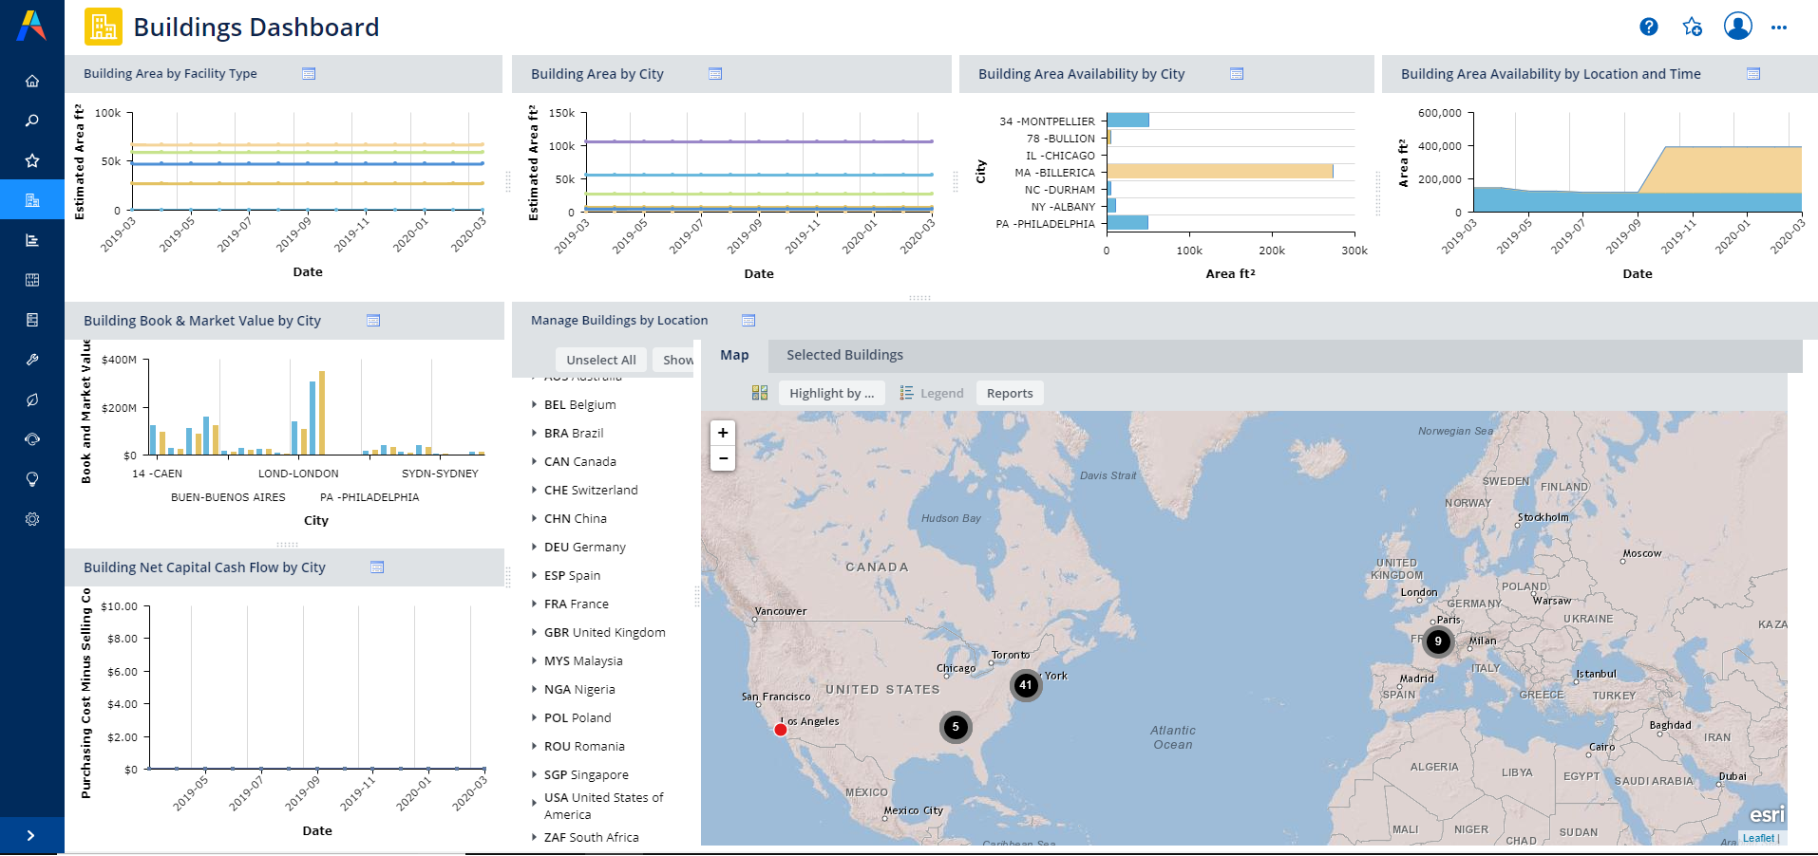
For example, if you are leasing or subleasing to others, some of your buildings, structures, and land, you need to know how much of your portfolio is currently available for your use, what is leased out, and what is in the pipeline. Using the Buildings Dashboard view, you can view key performance indicator charts that show the estimated area for your buildings in a particular geographical area broken down by the availability of that building's space. You can view this information on a timeline to visualize and assess the trends for how you are using your building area. This data supports your decision making for real property acquisitions and disposals.

|
Portfolio |
|
|---|---|
|
Location |
Archibus non-SaaS:
Archibus non-SaaS:
|
|
Business Result |
Your real estate portfolio optimally sized to fit your business needs by ensuring future needs are met without overspending. Increased transparency: with just a few clicks, you can drill down from the organizational portfolio level to an individual portfolio item. Reduced administrative overhead through easy and intuitive data entry and automatic data analysis tools. |
|
Used By |
Real Estate Directors Business Unit Managers Senior Management |
|
Reasons for Automating |
To create and maintain an electronic repository of your buildings, structures, land, and leases, using a simplified wizard interface. To create a common operating picture of land, structures, buildings and leases that provides a solid basis for analysis and collaboration among real estate stakeholders. To perform time-line analysis to examine current and past use, and project future needs. To view KPI charts that aggregate your data for your entire portfolio or a single item. To view your data grouped by the information you need. You can select the geographic locations, facility types, availability, and ownership status for grouping the data. To examine portfolio items on a geospatially-enabled map. To use dashboard charts, summary statistics, reports, and map views to effectively plan acquisition and disposal, and to communicate the analysis to senior management. To visualize the total impact and effectiveness of real estate spending across all business units by reviewing dashboard data, including key performance indicator charts and summary statistics. |
|
Prerequisite Applications |
None |
|
Results/Reports
|
Buildings/Structure/Land by …Country/Region/State/City/Site/Property Building/Land Area by Country/Region/State/City/Site/Facility Type/Property/Building Building/Land Area Availability by Country/Region/State/City/Site/Facility Type/Property/Building Building/Land Area Availability by Location and Time Building/Land/Structure Net Capital Cash Flow by Country/Region/State/City/Site/Facility Type/Property/Building Building/Land/Structure Book & Market Value by Country/Region/State/City/Site/Facility Type/Property/Building Leases and Suites by Building Leases by Structure/Land Documents by Buildings/Structure/Land Documents by Lease Contacts by Buildings/Structure/Land Contacts by Lease Portfolio Investments Portfolio Sales All Ownership Transactions All Properties and their Book Values All Buildings and their Book Values Buildings Dashboard |