What's New in Archibus V.26.2?
Web Central Enhancements
We continue to improve Web Central with these enhancements:
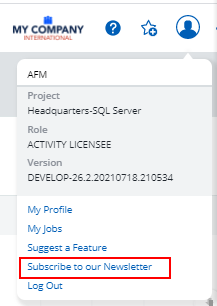
Subscribe to the Archibus Newsletter
Stay up-to-date with the latest Archibus news by signing up for our quarterly newsletter using the command in the User menu. Enhance your Archibus experience with news of the latest product releases, events, training offerings, case studies, tips, and more.
Reports Central: Group, Sort, and Aggregate Data (UserVoice Idea)
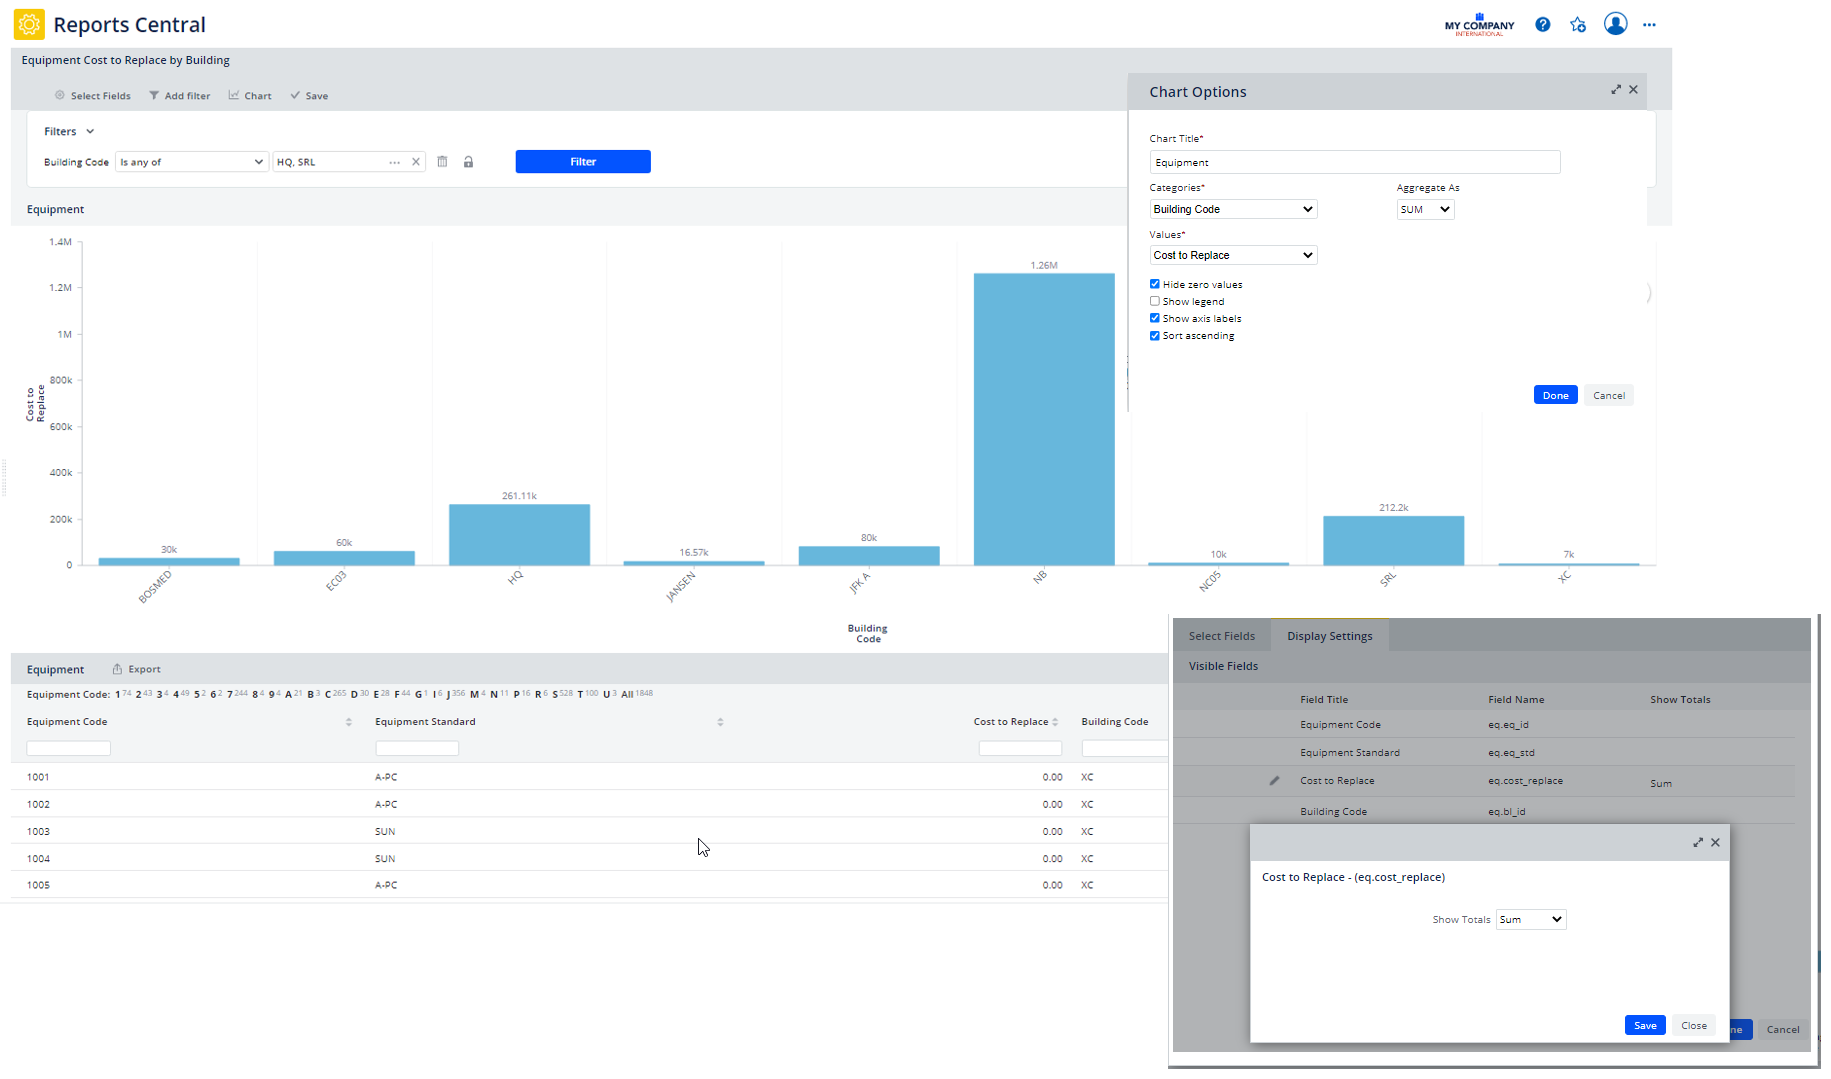
Facility managers want to group data into categories and specify the aggregation function for the values (count, sum, average, minimum or maximum). This enables decision-makers consuming the report to receive useful, summarized information. V.26.2 supports this need with these enhancements:
Charts
When you create charts summarizing your data, you can take advantage of these new features:
-
The Aggregate As option enables aggregating values as SUM, AVERAGE, MIN, MAX or COUNT. This option groups Values (such as Cost to Replace) by the Categories field (such as Building). Note that COUNT can be used with any field in the Values list, as it is a count of records.
-
The Hide Zero Values option hides zero values from the chart. This is helpful to produce a cleaner chart in cases where there are categories without data. For example, this option hides all buildings where the SUM of the cost to replace is zero.
-
The Sort Ascending option sorts in ascending order the Categories axis by the Categories value. For example, alphabetically sort from A to Z all buildings by Building Code in ascending order.
Grid
The Reports Central grid shows the details of your data, and has these changes:
-
You can now sort in ascending or descending order by a column in the grid. This sort impacts only the grid data.
-
Each column now has a Smart Search filter, which enables you to additionally filter only the grid records.
-
For each numerical column (number with decimals or integer), you can now choose to total the column as SUM, AVG, MIN or MAX. After you choose how to calculate at least one column, the calculation line appears at the bottom of the grid. If there are many records in the grid, you must scroll.
Example
You can create an "Equipment Cost to Replace by Building" report with a chart that sums the Cost to Replace values per building and sorts in ascending order, and a grid that totals the overall Cost to Replace values.
Details
View
-
System / Add-In Manager / Reports Central (ab-rpt-wiz-main.axvw)
Help Topics
Maintenance Console: UX Improvements
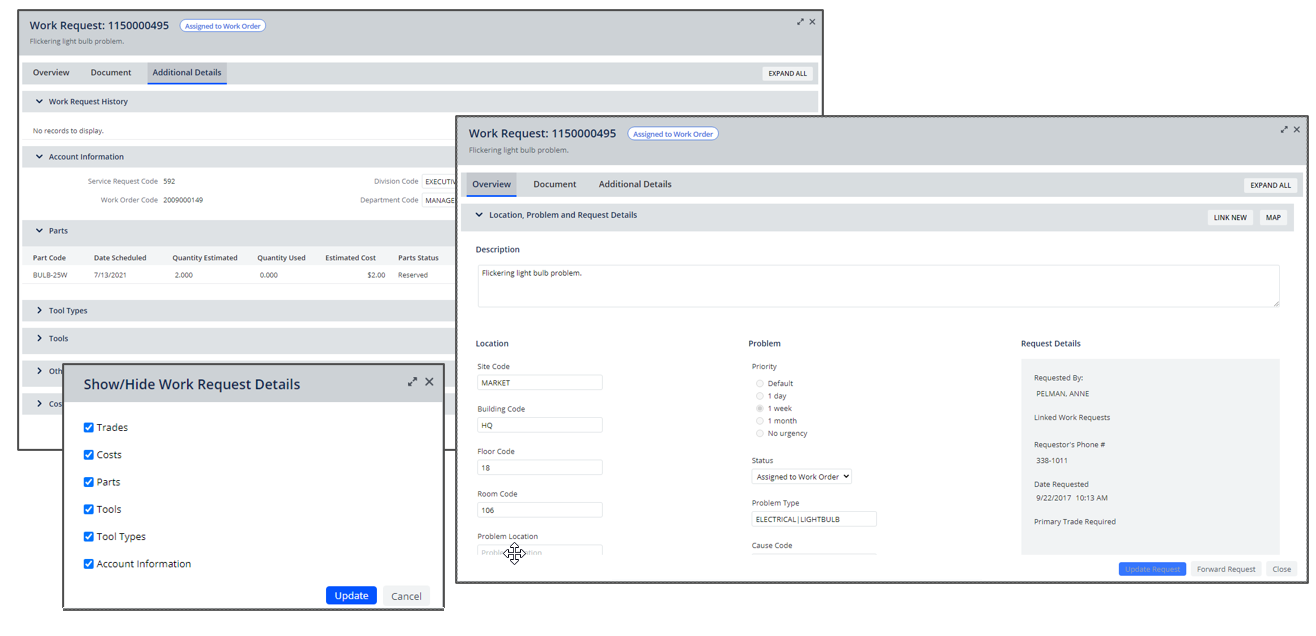
We have improved the user experience of working with the Maintenance Console so that key information is immediately available without any clicks, and less important information (parts, tools, and so on) is grouped separately. The Overview tab presents the key work information, and you can drill into details using the Document and Additional Details tabs. Forms have been redesigned to collapse sections by default, and fields have been re-arranged and moved.
Additionally, users with appropriate security can control the fields displayed using the Show/Hide Work Request Details form, available from the Options drop-down menu.
Accessing data quickly is an important part of the user experience; accordingly, we have also made several behind-the-scenes changes to improve performance and load time. Maintenance supervisors managing thousands of tickets will find that they can more quickly access their data.
Details
Views
-
Maintenance / Corrective Maintenance / Supervisor / Maintenance Console (ab-bldgops-console.axvw)
-
Maintenance / Preventive Maintenance / Supervisor / Maintenance Console (ab-bldgops-console.axvw)
Help Topic