Technologies / Innovative Solutions / Integrations - BMS
Equipment Diagnostic History Report
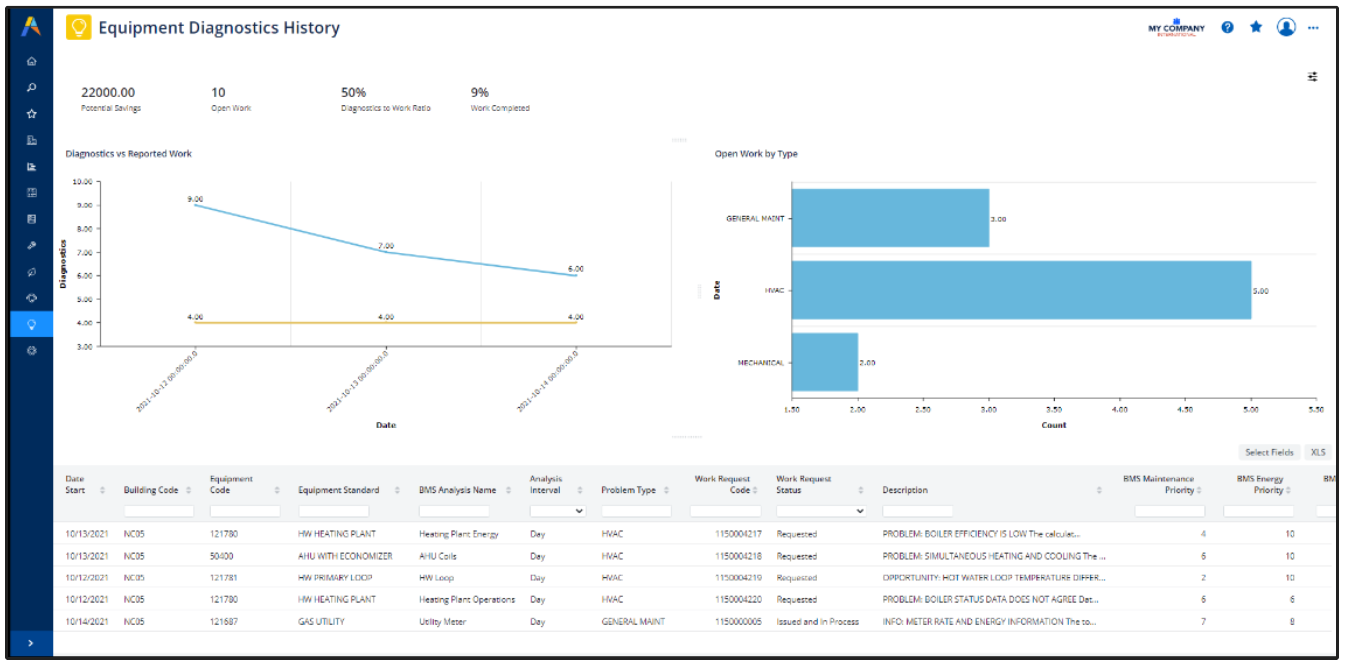
Maintenance managers can find the full history of imported diagnostics for the portfolio of assets by consulting the Technologies / Innovative Solutions / Integrations - BMS / View Equipment Diagnostics History report (ab-iot-bms-eq-dash.axvw). The report provides features for exporting to Excel as well as setting the exact fields to display.
The report includes such information as:
-
summary charts showing potential savings, counts of diagnostics over a time period, a count of work requests generated from diagnostics
-
the equipment on which the analysis was run, and its equipment standard
-
the analysis that was run by the BMS/ Clockworks system and which resulted in this diagnostic. This is stored in BMS Analysis Name.
-
the diagnostic result from Clockworks, stored in the Description field. If the text is too long, hover the field for the tooltip that shows the entire text of the diagnostic.
-
the Work Request Code, if the diagnostic priority and other configuration options dictated that a work request be generated

Use the Smart Search Console to filter by Equipment Code to show a history of imported diagnostics for the equipment. For example, the below image shows the diagnostics for item 121780.

Note: Archibus has provided four sample reports that analyze BMS equipment diagnostics and associated work requests. However, these reports are not automatically included in the HQ sample database. If you desire to use these reports, import them manually by using the Database Update Wizard to run %archibus%/projects/users/public/dt/v2022.01.001/sample-data/reports/update-sample-data.duw.
Metrics
The metrics are calculated as follows:
| Metric | Type | Summary | Calculation | Purpose |
|---|---|---|---|---|
| Potential Savings | Single Value Metric | Sum of cost savings field for diagnostics that have associated work requests | SUM(cost_savings) FROM bms_eq_diagnostic AND bms_eq_diagnostic.wr_id IS NOT NULL WHERE <filter criteria, including date interval> | Look at his dollar amount to estimate how much you would have saved in energy and maintenance costs if fixing all the high priority diagnostics. |
| Diagnostics (Count) |
Trendline Displayed on the chart with Reported Work |
Count of diagnostics over time. |
COUNT(*) FROM bms_eq_diagnostic WHERE <filter criteria, including date interval> GROUP BY date_start | In conjunction with the Reported Work trend, the Diagnostics trend can tell you if the work that you have done has led to better health of assets. |
| Reported Work |
Trendline Displayed on the chart with Diagnostics (Count) |
The count of work requests auto-created from diagnostics, disregarding of work request status |
COUNT(wr_id) FROM bms_eq_diagnostic WHERE wr_id IS NOT NULL AND <filter criteria, including date interval> |
Look for inflexion points and compare the two trends. For example: If Diagnostics is trending down, but Work Requests is trending up, there might be an increase in critical problems. This could is a sign of deteriorating asset health or bad data quality. |
| Active Work | Single-value metric | The count of work requests auto-created from diagnostics, that are still open. | COUNT(wr.wr_id) FROM wr, bms_eq_diagnostic WHERE wr.wr_id = bms_eq_diagnostic.wr_id AND bms_eq_diagnostic.wr_id IS NOT NULL AND wr.status NOT IN ('Rej','Can','Com', 'Clo') AND <filter criteria, including date interval> | This value tells you the size of the work backlog. Large number of open work request could be a sign of inefficiency of potential systemic problems. |
| Active Work by Problem Type | Chart | The count of work requests auto-created from diagnostics, that are still open, grouped by Problem Type. | COUNT(wr.wr_id) FROM wr, bms_eq_diagnostic WHERE wr.wr_id = bms_eq_diagnostic.wr_id AND bms_eq_diagnostic.wr_id IS NOT NULL AND wr.status IN AND <filter criteria, including date interval> GROUP BY wr.prob_type ORDER BY wr.prob_type DESC | Similar to above, but this chart helps you pin-point the problem that leads to a larger amount of open work, so that you can focus on fixing the most pressing problems. |
| Diagnostics to Work Ratio | Single-value metric | Percentage of diagnostics automatically converted to work requests. |
Formula: (Count of work requests auto-created from diagnostics) / (Count of diagnostics) * 100 |
This value enables you to estimate on average how many new work requests you get for every 100 new diagnostics. Useful for planning future maintenance effort and team size. |
| Work Completed (%) | Single-value metric | Percentage of work requests generated from diagnostics that had been completed or closed. | Formula: (Count of work requests auto-created from diagnostics that have been closed or completed) / (Count of work requests auto-created from diagnostics) * 100 | This metric helps you understand whether or not the maintenance resources are keeping up with demand. A larger Work Completed (%) is better, but it is unlikely that this will reach 100%, since there could always be new problems coming in. Even a 50% completion percentage is typically considered to be somewhat high. |