Archibus Web Central
Charts
Charts are used in several Web Central applications.
HTML Charts
This topic covers the HTML chart control. Beginning with Archibus V23.2, Web Central views were standardized to use the HTML chart control instead of the Flash chart control, which was used with previous releases. If you have a custom view that uses the Flash chart control, you will find that its chart works slightly differently than described in this topic.
The following features of Flash Charts are not available with HTML charts:
- The HTML Chart control does not offer the ability to export to Word. As a work-around, you can take an image grab off the screen and paste it into Word.
- The HTML Chart control does not filter by dates.
Zooming in
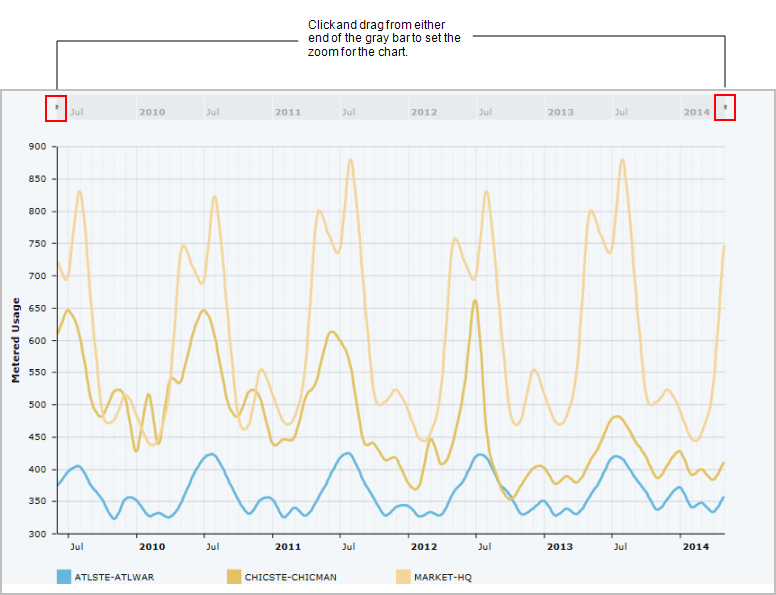
Charts can include the ability to zoom in so that the chart shows an area of interest. This feature eliminates the need to use From and To Dates in a Filter.
- A gray bar at the top of the chart controls the x axis.

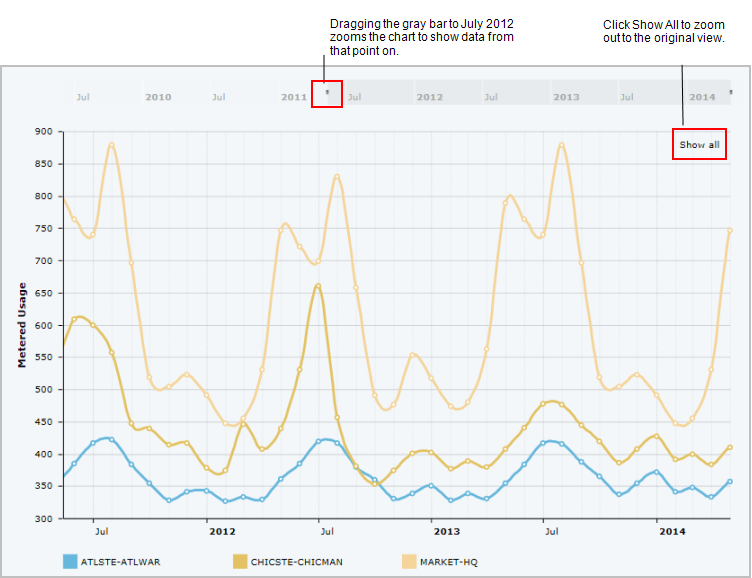
- When you drag the bar, the chart zooms in to show data for this portion of the x axis. This enlarges the data, so it is easier to examine.
- To zoom out to the original view, click Show All

Viewing Chart Labels
In a small chart window, you may not be able to see the chart labels. In this case, you can maximize the chart panel to see the entire label.
Exporting Charts
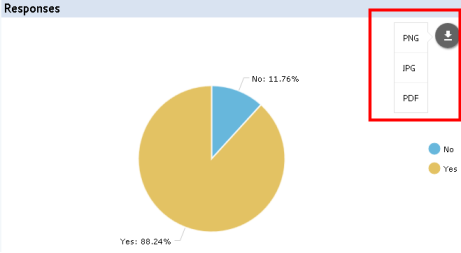
A chart can offer the option for exporting the chart as a JPG, PNG, or PDF.
Mouse over the Export icon in the upper right corner of the chart window, and the chart displays a menu of the available export options. Select an option and Web Central presents a form prompting you to choose one of the following actions.
- open the generated image or PDF in another program. From the selected program, you can name and save the image or PDF as desired.
- save the chart with a generated name. In this case, the system saves the image or PDF to the C:\Users folder.
