Real Property / Forecasting / Portfolio Forecasting
Headcount Projection Chart
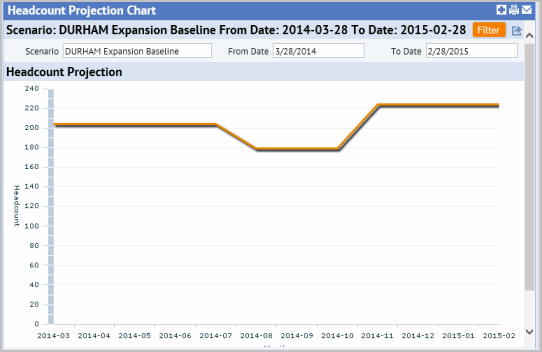
The Headcount Projection chart uses the Employee Headcount data for each group in the Portfolio Scenario, and projects it through a selected time period. You can change the scenario and time frame for the chart. Click Filter to generate the chart using your selections.
You can export the chart to a DOCX or PDF file by clicking the Export icon.
The below image shows the Headcount Projection Chart:
