Real Property / Strategic Financial Analysis
Assets / Enterprise Assets / Asset Lifecycle Console
Assets / Assets / Asset Lifecycle Console
Selecting Analysis Metrics
The Select Metrics action enables you to select the metrics shown in the view from which you run the action. The action is available from the following places in the Financial Analysis console, and also when working from the Optimization tab of the Asset Lifecycle console:
- Analysis Scorecard
- Asset Scorecard
- Analysis Map
- Asset Map
- Site Map
- Lifecycle and Metric Trend charts - from the Asset Lifecycle Console.
When you open the Select Values dialog, it shows the analysis metrics that are currently visible. These fields are defined in the Financial Analyses (costanal_analyses) record for the current analysis.
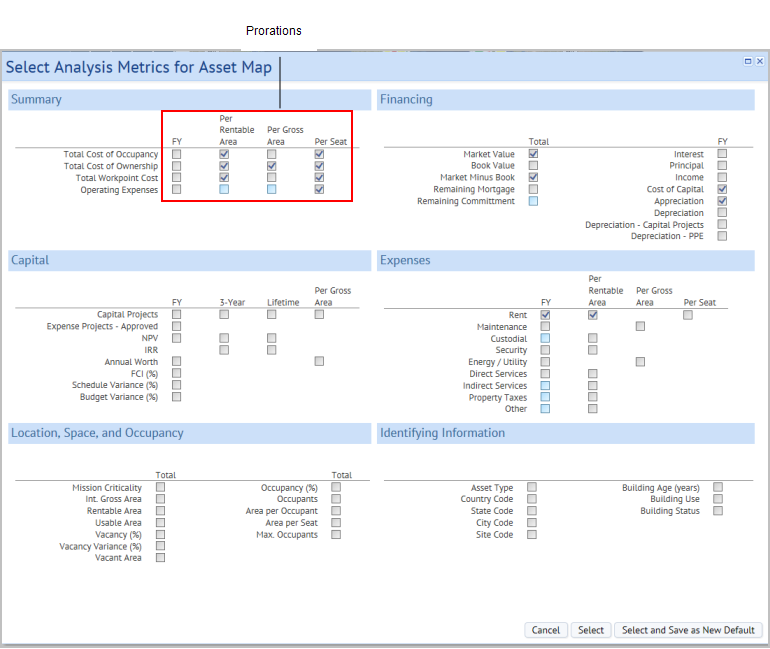
The Select Metrics dialog lets you choose prorations appropriate for each metric. Although your facility may have greatly different sizes and costs may have greatly different magnitudes, the program can use these prorated values to rate them on an even basis against normalized benchmarks

If you change the selected fields and click Select button, the map, scorecard, or chart refreshes to show these metrics.
Setting a default set of metrics
Typically, you will have a set of metrics that you use repeatedly in your analyses. You can set these metrics as a default, so that you don't need to select them each time.
To set default metrics, use the 'Select and Save as New Default' action button. The dialog saves your selections as the default, and shows these metrics in the view when you close the dialog.
Restrictions on your selections
The following table shows the restrictions on your selections when doing different analyses.
| Analysis | Limit selection to how many values? |
|---|---|
| Analysis Scorecard | 7 |
| Asset Map | 2 |
| Site Map | 1 |
| Asset Scorecard | No limit |
| Metric Trends Chart | 5 |
| Lifecycle Analysis Chart | 4 |
Selecting Metrics from the Optimization tab of the Asset Lifecycle Console
When working from the Optimization tab, you can use the Select Metrics action from:
- The Financial Analysis panel to select the metrics that display there
- The Lifecycle Analysis chart or the Metric Trends Chart to select the metrics that appear in the chart. From these charts, you can click on a metric in the legend to hide or show the metric in the chart.
Tip: You can select to display any value in the Lifecycle chart, although graphing a rate (such as IRR) next to a value (such as Operating Costs) might not be useful.