Capital Projects / Capital Budgeting
Project Budget versus Spend Analyzer
Capital Planners can use the Project Budget vs Spend Analyzer task to:
- Analyze annual capital budgets approved for past years versus actual spend based on finance year-end invoicing
- Analyze quarterly results for any fiscal year you specify
- Drill-down into invoice detail to explain unexpected numbers
- Access capital budget and monthly actual invoice totals by project
After you have imported your legacy data, you can review project data in the Capital Budget vs Spend report.
Budgeted Costs are derived from the Project Budget and divided evenly over the course of the Project, using the project estimated Start and End dates. The Actual Spend is summed from Invoice amounts.
Tips on using this report:
- Click the question mark
 to see a detailed description of the report.
 - Click on a bar or line in the report to drill down to see the projects contributing to the total. When clicking on a line graph, mouse over the line until you see the tool tip; click at this point in the line to see the projects contributing to the total for that point in time.
Filtering the report
Using the Filter, you can generate this report for:
- budget vs spend. This report shows incremental data.
The following reports show cumulative values summed from the Project Start Date.
- cumulative budget vs spend.
- cumulative budget
- cumulative spend
You can select the year to review and whether to total the data by month, quarter, or year. Additionally, you can restrict the report to a specific location, program, project, or date range.
Approved?: You can select to review only Approved projects, or you can remove the selection from the Approved check box to see all projects in any status prior to Approval or not Approved. Approved Projects include projects with an Approved, Issued, Completed or Closed status.
Project Budget vs Spend Analyzer
The following shows the Project Budget vs Spend Analyzer report and the drill down you can do to see the details contributing to the total. The drill down helps you analyze any unexpected numbers.
These images show the report generated for the Budget vs Spend option, although you can also generate the report for the options noted above in the section of this topic on Filtering the report.
The following shows the Budget vs Spend view that provides the overall summary of the amounts budgeted and spent for all projects included in the report.

Drill down to view projects and invoices for that time period. Click on a bar to see the projects and invoices contributing to the total.

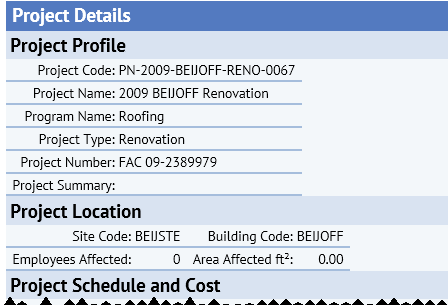
Review project details. Click on a project to see project details, including the project's profile, location, schedule and costs, and contact information.

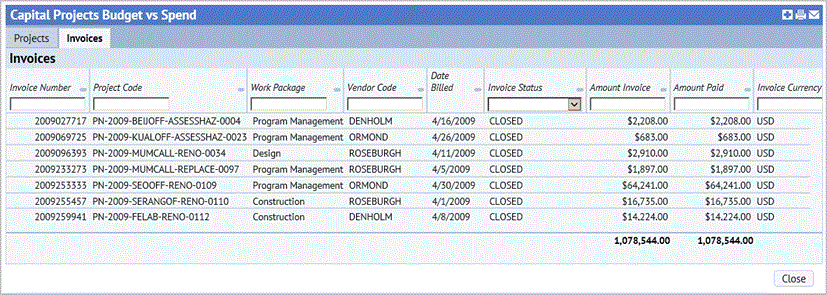
Review invoices. Select the invoices tab to see a list of invoices contributing to the spend total.

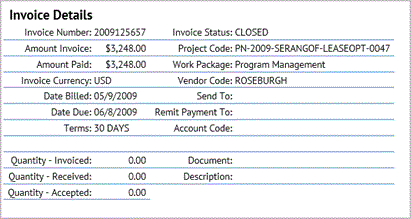
Review invoice details. Click on an invoice to see invoice details.
