Sustainability & Risk / Energy / Energy Manager & Facilities Director
Utility Analysis Console
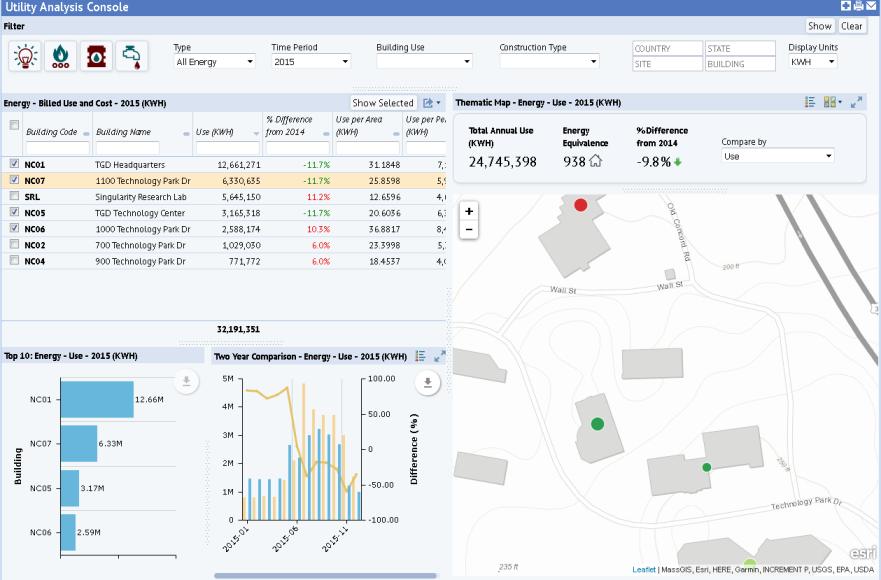
With the Sustainability & Risk / Energy / Energy Manager & Facilities Director / Utility Analysis Console task, you can readily assess multiple metrics for one or multiple utilities for buildings grouped, sorted, and filtered by location, use, and construction type. At any point, a snapshot of an individual building’s profile and utility history is only one click away. A total of three clicks can move you from examining energy use per area or occupant for all buildings in a portfolio to initiating a detailed facility assessment or beginning a new request for a capital project to effect improvements. In between are selections for many different sums, ratios, and other metrics plus details of individual bills, meter data feeds, departments and equipment. The Utility Analysis Console combines enterprise facility, utility, asset, and occupant information in one place to deliver knowledge for powerful decisions concerning energy strategies.
The energy manager can select a set of buildings to analyze and see the energy use by building over a two year period. Use this console to:
- see multiple metrics for overall energy usage, or broken down by electricity, water, oil, and natural gas
- compare statistics for selected buildings
- view energy use in terms of household energy use
- drill into the summary charts for details
- view energy usage on thematic maps
- access the Building Snapshot pop-up, which provides details about the selected building, its equipment, and current projects. Examining this data can help you understand the factors contributing to your energy usage. From the Building Snapshot, you can:
- access Green Building scores (if available) from the Profile tab
- examine floor plans, which may be helpful in understanding the metrics
- review and edit meter readings
- examine a building's equipment and the equipment items' energy specifications
- create assessment projects so that you can see how your field assessments match to the metrics and summary data
- review and work with non-assessment projects associated with the building
Setting the Filter
Use the filter to select the utility bill data that you want the console display.

The Utility Type, Time Period, and Display Unit filter selections persist to the Building Snapshot dialog for a selected building. They are also reflected in the Two Year Comparison chart and Meters tab of the Building Snapshot view (described later in this topic). For clarity, the console displays the selected Bill Type, Time Period, and Display Unit in the title bar of the report, chart, and map panels.
The other items in the filter (Building Use, Construction Type, and location fields) limit the list of buildings displayed in the "Billed Use and Cost" form.
| Option | Description |
|---|---|
| Utility Type |
Use the quick-select icon on the left to choose electricity, fuel, natural gas, or water bills (the bill types represented in the bill_archive table, such as ELECTRIC, NATURAL-GAS). The Type option adjusts to the icon that you select. If you do not choose an icon, the Console sets Type to "All Energy." Rather than using the quick-select icons, you can also select the utility type form the Type drop-down list. |
| Time Period | You can choose from the calendar years that are found in the bill_archive table. You can always choose "Past 12 Months." The remaining options are the calendar years for all years found in the bill_archive table. |
| Display Units |
Selecting a Bill Type changes the options in the Bill Units drop-down menu to those Bill Units which are defined for the selected Bill Type. For example, selecting WATER shows the Bill Units available for Bill Type WATER. In the HQ database, these are CCF (default), GAL, m3 and TGAL. Thus, once you select a utility type, you will not want to change this option. |
Once you set the option, click “Show." The console filters all the reports visible on the page and displays the data in the selected Display Units.
The building list shows only those buildings that meet the filter criteria. From this list of buildings, you can further select the buildings whose data you want to display and compare, as described in the following section.
Selecting the Buildings, the Energy Type, and the Values to Compare
The Utility Analysis Console can show a wealth of information depending upon the options you choose to report on. Set the following options to report on various types of energy data for a varied set of buildings.
Buildings
Once you set the filter, you can focus the data on a specific set of buildings. In the Bill Use and Cost pane, click on their check boxes and choose Show Selected. The other panes in the console (the charts, the map, and the equivalency statistics) will show data only for these buildings. Use the Clear option in the filter to clear the selection of buildings. This is handy for comparing the statistics for a set of buildings.
Use and Cost
By default, the console reports on use data. However, you can use the “Compare By” option, located above the map, to change the calculated values shown in the charts, the map, and in the Building Snapshot form (discussed below). Set Compare By to one of the following: Use, Use per Area, Use per Person, Use per Person per Day, Cost, Cost per Area, Cost per Person, Cost per Unit.
Energy Type
The Energy Type selected in the filter controls the statistics presented. As discussed above, you can show all energy bills at once, or each type of energy on its own.
Billed Use and Cost
For the selected utility type, the Billed Use and Cost pane presents a list of buildings meeting the restriction and key metrics about utility use.
You can quickly scan the metrics for each building to compare performance.

| Statistic | Calculation |
|---|---|
| Use |
SUM(bill_archive.qty_energy) if > 0, otherwise, SUM(bill_archive.qty_volume). The value is divided by the conversion factor (bill_unit.conversion_factor) used to convert the stored value from the common unit to the Display Unit |
|
% Difference from [Previous Year] |
(Current Year Use – Previous Year Use) * 100 / Previous Year Use The "current year" is the year that you select in the Time Period option in the filter. For example, if you select 2014 for this option, the column will read "% Difference from 2013". |
| Use per Area | Use (shown above) / Occupancy (see below) |
| Use per Person | Use (shown above) / Occupancy (see below) |
| Use per Person per Day |
Use (shown above) / 365 * Occupancy (see below) Note: in the Two Year Comparison chart, since this data is displayed by month, the calculation is: Use (shown above) / 30 * Occupancy (see below) |
| Cost | SUM(bill_archive.amount_expense) |
| Cost per Area | SUM(bill_archive.amount_expense) / bl.area_gross_ext |
| Cost per Person | SUM(bill_archive.amount_expense) / Occupancy (see below) |
| Cost per Unit | SUM(bill_archive.amount_expense) / Use (shown above) |
| External Gross Area | bl.area_gross_ext |
| Occupancy | Occupancy is calculated as the sum of employees in the em table for the building. If this is zero, then the calc uses bl.count_occup . |
Top 10 Chart
Located beneath the Bill Use and Cost pane, the Top 10 chart is a bar chart for building comparison. By default, the chart displays Use values. You can change this using the Compare By option, located above the map. Set the “Compare By” to change the calculated value shown in the two charts and the heat map as well as the chart in the Building Snapshot dialog. The available values are Use, Use per Area, Use per Person, Use per Person Per Day, Cost, Cost per Area, Cost per Person, Cost per Unit.
The Buildings are displayed sorted by the value, descending. The Top 10 buildings are shown; if you have selected a set of buildings by clicking on them, the chart shows the selected buildings in descending order.
Clicking on a row in the chart opens the Building Snapshot (discussed below) for that building.
Two Year Comparison Chart
Located beneath the Bill Use and Cost pane, the Two Year Comparison Chart shows values by month for the selected year vs the previous year. The values are summed for all selected buildings. The chart also displays a line chart showing the % Difference value between the Previous Year and the Selected Year.
In the column chart, each stack represents a month for the previous year (khaki) or the current year (blue). In the above image, there is data only for January and February 2016, so the chart shows only two sets of stacks. If there were data for an entire year, the stack would show 12 sets of stacks.
Clicking on a stack in the chart opens a grid showing bills for the that month in the selected year and the previous year. Once you open the grid, you can click on a row record to open the bill line details.
Calculation Note: for Use per Area, the total Use for all Buildings is divided by the total Area for all buildings to get an overall Use per Area value.
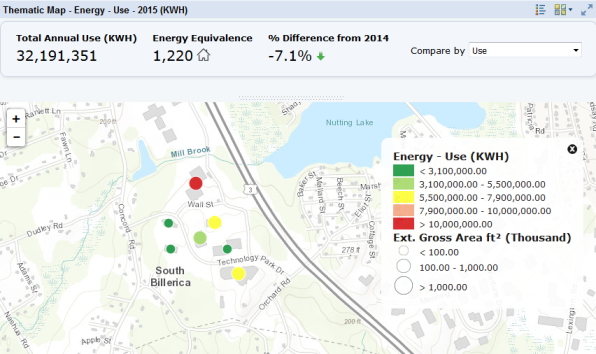
Energy Equivalence
At the top of the Thematic Map pane, the console displays additional statistics about the selected buildings.

| Value | Description |
|---|---|
| Total Annual Use | sum over all selected buildings |
| Household Energy Equivalence |
This value describes the Total Annual Use in terms of the number of average households that would consume the same amount in a year. The value is titled differently depending upon the bill type selected (for example, Energy Equivalence, Electricity Equivalence, Water Equivalence, depending on the filter set). The number is followed by a house graphic to represent household equivalence. For details, see below. |
| % Difference from [Previous Year] | This shows the percentage difference and uses an arrow graphic is a red “up” arrow for positive values or a green “down” arrow for values below zero. |
Determining Household Equivalence
The following values are used as standards for calculating the household equivalence. When two values are listed, the first is the value determined by research and the second is the same value in the common unit.
For Natural Gas and Heating Oil, these are values for households that use these utilities as their primary source of heating during the winter.
| Energy Type | Household Standard | Source for Standard |
|---|---|---|
| (All) Energy |
90 MMBTU/year |
https://www.eia.gov/consumption/residential/ |
| Electricity: |
10,812 kWh/year |
|
| Water: |
400 gallons/water/day |
|
| Natural Gas |
74 MCF/year |
https://www.eia.gov/pub/oil_gas/natural_gas/feature_articles/2010/ngtrendsresidcon/ngtrendsresidcon.pdf |
| Heating Oil |
481.5 gallons/year |
http://www.eia.gov/outlooks/steo/tables/pdf/wf-table.pdf |
Thematic Map
If you have geocoded (provided map coordinates) your buildings that have bill_archive records, the console will display a thematic map; if you don't have map coordinates defined in the database, the console does not display this panel.
The map shows markers for the buildings highlighted by the statistic you choose in Compare By (Cost, Use, Cost per Area, and so on). The size of the markers represent the Building Area.
In the upper right corner of the map, you can access icons for the following. From left to right, the icons are:
| Icon | Description |
|---|---|
| Show Legend |
Opens the Map Legend, as shown in the above image. The Legend shows:
As you change the value in Compare By, the legend text and values update to indicate the measurement that the color is representing. For example, if you choose Cost, the label changes to Energy Cost and the numeric values update to new ranges. |
| Base Map |
Opens the drop-down menu to change the Basemap. The default basemap is World Light Gray Canvas. |
| Expand (double arrow) |
Opens the map in a larger dialog. Any selection change made in the expanded map view are also reflected in the smaller map and chart in the parent view. For example, if the user expands the Map and selects Compare By “Use per Person” and closes the expanded Map, the smaller map and the chart should both display “Use per Person”. |
Clicking on a marker opens the Building description dialog with key information about the building. You can access complete information by clicking the link at the bottom of this dialog to open the Building Snapshot dialog.
Building Snapshot
The Building Snapshot is a pop-up view that offers detailed information about the building. Access this pop-up from:
- clicking on a Building record in the Billed Use and Cost pane
- clicking on the Top 10 chart
- clicking on the “View Building Snapshot” link after selecting a building marker on the map.
The Building Snapshot displays the Building image (bl.bldg_photo) and an Energy Equivalence panel with selected metrics, along with a series of tabs, as described below. If you notice a trend or outlier in your energy statistics, you can use this view to check a building's details and its detailed energy information.

Energy Equivalence Panel
The Energy Equivalence panel is located at the top of the dialog and is restricted to the selected building; it uses the Bill Type, Time Period, and Bill Units selected in the opener filter console. It contains the following fields:
| Value | Description |
|---|---|
| Annual Billed Use | Sum for selected buildings |
| Energy Equivalence |
This value describes the Annual Billed Use in terms of the number of average households that would consume the same amount in a year. The value is titled differently depending upon the bill type selected (for example, Energy Equivalence, Electricity Equivalence, Water Equivalence, depending on the filter set). The number is followed by a house graphic to represent household equivalence. For details, see below. |
| % Difference from [Previous Year] | This shows the percentage difference and uses a red “up” arrow for positive values or a green “down” arrow for values below zero. |
| Use per Area | |
| Use per Area as % of Avg Commercial Building | Uses a red “up” arrow for positive values or a green “down” arrow for values below zero. |
The following are the standards used to represent an average commercial building:
| Energy Type | Standard |
|---|---|
| (All) Energy |
80,000 BTU/sq ft 0.080 MMBTU/sq |
| Electricity: |
51,000 BTU/sq ft 0.051 MMBTU/sq ft |
| Natural Gas |
38,000 BTU/sq ft 0.038 MMBTU/sq ft
|
The source for the value for "All (Energy)" is: https://www.eia.gov/consumption/commercial/reports/2012/energyusage/
Profile Tab
The profile tab shows a building profile on the left and a column chart on the right.
The building profile also shows the most recent Green Building score, if it exists and lists the latest Green Building certification details. If no certification records have been entered for the building, these three fields are hidden in the building profile and the title of the panel is “Building Profile” instead of “Green Building Score and Profile.”
The latest certification is determined by using the last date_certified found in the gb_cert_proj table for that building.
- Building Certification (gb_cert_proj.project_name + gb_cert_proj.cert_std)
- Building Score (gb_cert_proj.tot_final_score + gb_cert_proj.certified_level)
- Date Certified (gb_cert_proj.date_certified)
The Two Year Comparison is similar to the same chart in the opening view, but restricted to the selected building. The drilldown works similarly to the same chart in the opening view.
Departments tab
The Departments tab presents rooms in terms of their departments. Use this tab to check the department to which high-consuming rooms or equipment are assigned.
Equipment Tab
While reviewing your energy use and cost, you might want to review the equipment items that consume energy. The Equipment tab displays Energy Specifications for equipment found in the building. The energy specifications are entered using the Sustainability & Risk / Energy / Background Data – Facilities / Define Equipment Standards view. Equipment without energy specifications is listed at the end.
The per-row Status button opens the Equipment Condition and Status dialog and presents key fields so that you can check individual equipment items.
Meters Tab
For a better understanding of a building's energy use, you can examine the individual meter recordings that contributed to the energy usage and cost values. The records are restricted by the Bill Type and Time Period selected in the Filter console.
The Meters tab contains two panels:
- a Meters category grid
The per-row Details button opens the Define Meter view.
The Show Selected action shows the selected meters in the pie chart. By default, when the view loads, all non-virtual meters are selected except for the Building meters. The exception is when there are only Building meters listed; then, the first building meter is selected. (A non-virtual meter is a meter with
bas_data_point.meters_to_include = null.)The Add menu action provides two menu options:
- Add Meter – opens the Define Meter view
- Add Meter Data – opens the Process Meter Data view, restricted by the selected building
- a pie chart displaying Metered Use as % of Billed Use.
- Clicking on the pie chart opens the Meter Readings by Month dialog showing
bas_data_time_norm_num records WHERE interval=’MONTH’. For quarterly and yearly meters, the interval shown is ‘QUARTER’ or ‘YEAR’, respectively, since monthly records are not created for these meters. - Metered Use is the total measured consumption for the meter for the year selected. These values are derived from bas_data_time_norm_num table. The monthly summary values are used in most cases. For quarterly or annual meters, the quarterly or annual values are used.
- An additional calculated field “Other Billed Use” may be shown in the pie chart. This value is the difference between the Billed Use and the total Metered Use, if any. If the total Metered Use exceeds the Billed Use, the value for Other Billed Use will be zero, and will not be displayed. The calculation is:
Other Billed Use = (SUM(bill_archive.qty_energy) – (SUM(bas_data_time_norm_num.value_common))/ conversion_factor)
- Clicking on the pie chart opens the Meter Readings by Month dialog showing
Meters Report
The Meters report lists all meters located in the building of the selected Bill Type.
- bas_measurement_scope.bl_id = [selected bl]
- bas_data_point.bill_type_id = [selected bill type]
The meters are grouped into three categories:
- Building – this is a whole-building meter (no bas_measurement_scope fl_id, rm_id, zone_id or eq_id is specified)
- Equipment – meter assigned to an Equipment Code (bas_measurement_scope eq_id)
- Floor/Room/Zone – meters assigned to a Floor, Room or Zone (bas_measurement_scope fl_id, rm_id or zone_id).
Annual Metered Use is the total measured consumption for the meter for the year selected.
Drawings Tab
The Drawings tab shows all drawings for all floors in the selected building. Choose a floor in the left column, and the tab displays its floor plan drawing, highlighted by departments (if available). Accessing the floor plan drawing is handy when investigating a building's energy usage and trying to pinpoint problems. Perhaps a building has several floors that are dedicated to manufacturing and therefore use a lot of energy.

Assessments Tab
The Assessments tab lists Assessment Projects created for the building. The Assessments tab is only available for users who have a license for Condition Assessment or Sustainability Assessment. You may want to access assessment information so that you know when your building was last examined and items that were flagged as needing attention. These areas might be contributing to high energy usage. You can see how your field assessment matches up to your energy data.
The projects are restricted to those of project.project_type LIKE ‘%ASSESSMENT%’ and therefore includes project types: ASSESSMENT, ASSESSMENT – ENVIRONMENTAL, and ASSESSMENT – HAZMAT.
Clicking on the per-row Details button opens a report view displaying Project Details and Reported Assessment Items for the selected building.
The Assessment Items are restricted to those which contain a non-zero or non-null value in one of the following fields: Sustainability Priority, Condition Priority, Condition Value, Recommended Action, Classification, Action Title, Description, Document, Location, or Cost. This is to eliminate (usually auto-generated) Assessment Items which return no results.
Clicking on an Assessment Item opens the Assessment Item details.
Any Project that has a status of Created and was created by the user (Project Requestor = User em_id) is editable. The user can edit the Project Details. Click the Add button to Add a Project and edit Project Details.
Projects Tab
The Projects tab is similar to the Assessments tab excepting that it lists all non-assessment projects (not of project_type LIKE ‘%ASSESSMENT%’). Like the Assessments tab, the user can add and edit projects with status Created and for which they are the Requestor.
The Project tab is only available for users who have a license for Projects or Capital Budgeting.