Sustainability & Risk / Energy
How the Energy Application Determines Baseline Energy Use
Note: The following topic is a reference for understanding how the application calculates the weather model. The weather model provides the data that is critical to effectively evaluating your energy consumption and costs. For information on the tasks you perform to get started using the Energy application, see Energy: Application Overview.
The application develops a baseline equation that describes energy use for the baseline energy period. The baseline equation tells you how much energy the building would have used this year based upon the baseline's usage patterns, and this year's conditions (such as weather and number of days.)
To establish the relationship between cooling energy use and weather, the system performs a simple least squares fit linear regression on the energy used (kWh/day taken from the normalized cooling energy bill data) versus the cooling degree days (calculated based on the building's balance point), to determine a line that comes closest to all the bills.
Using the coefficients generated by the regression analysis, the system plugs in the current number of days and the current cooling degree days to predict what consumption would have been for the baseline.
The same process is applied to heating. The regression uses normalized heating energy bill data and heating degree days.
Finding the best fit line
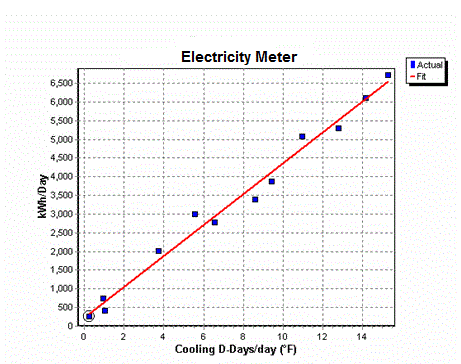
The following graph shows the kWh/day by the cooling degree days. The blue dots are the data points, and the red line is the best fit line, the line that comes closest to the most bills.

The best fit line has an equation called the fit line equation or the baseline equation that is determined by regression analysis. The best fit line (y=mx + b) is described by the coefficients obtained from the regression analysis. In the example, the regression analysis determined:
m= 5 kWh/Day
b = 417 kWh/CDD
So, the fit line equation in this example would be:
Baseline kWh = (5 kWh/Day * #Days) + (417 kWh/CDD * #CDD)
The fit line equation represents how you used energy during the baseline period and would continue to use energy in the future (in response to changing weather conditions), assuming no significant changes occurred in building consumption patterns.
Base Year bills ≈ Best Fit Line = Fit Line Equation
How the application uses the baseline equation to determine baseline energy use
Once you have the baseline equation, the application takes data from a cooling bill from some billing period after the baseline period, and plugs in the number of days from the bill and the number of cooling degree days from the billing period into the baseline equation.
For example, suppose for a current month's bill, there are 30 days and 100 CDD associated with the billing period:
Predicted kWh = ( 5 kWh/Day * #Days) + (417 kWh/CDD * #CDD)
Predicted kWh = (5 kWh/Day * 30) + (417 kWh/CDD * 100)
Predicted kWh = 41,850 kWh
Baseline usage: Since the baseline equation represents how you used energy in the baseline period, putting in the current number of days and number of degree days predicts how much energy the building would have used this year based upon the baseline usage patterns, and this year's conditions (such as weather and number of days.) The predicted energy consumption that is determined by the baseline equation is called baseline usage.
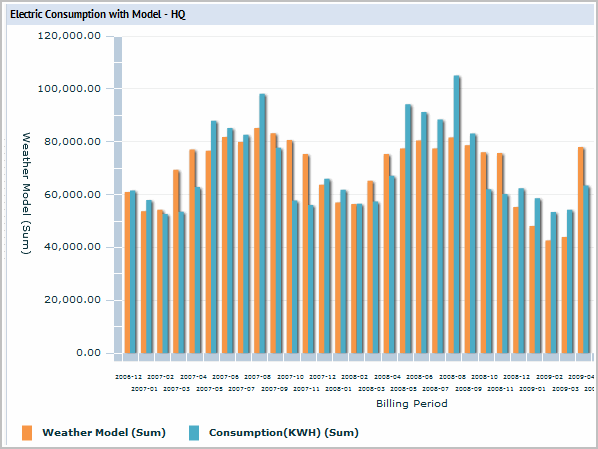
Now we can compare the actual consumption to the predicted baseline usage. In the graphs that display weather model data, the weather model represents the predicted baseline use. For example: the orange bars in this graph are the predicted consumption. The blue bars represent the actual consumption
