Space / Space Planning / Space Planner / Define Space Requirements
Real Property / Advanced Forecasting / Advanced Portfolio Forecasting / Define Space Requirements
View Space Requirements in a Chart
Once you create and modify your space requirements, you can view them in a chart that plots the organizational unit's space needs. The charts offer filters for limiting requirements to specified business units, divisions, or departments.
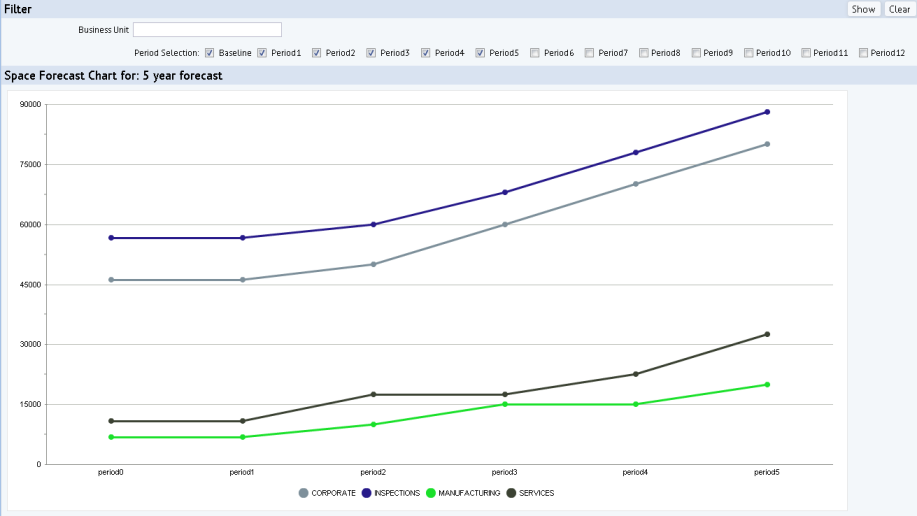
Choose the space requirement on the Select Requirement tab. Move to the Chart tab and complete the filter, if desired. You can use the filter to show just the desired forecast periods.
The system generates a line chart that has a line for each organization showing the total area requirements for each forecast time period. With this chart, you can graphically see how the forecast areas change over time. For example, the below chart shows how space needs for business units (Corporate, Inspections, Manufacturing, Services) change over a 5-year forecast; each period represents one year. Hover over a point on the chart to see the exact space requirement for a business unit for a particular period. In the filter, you should not select periods that are not in your forecast. In the below image of a 5-year forecast, only the Baseline and Periods 1 through 5 are selected in the filter.
