Space / Space Planning / Space Planner / Space & Portfolio Planning Console
Real Property / Advanced Forecasting / Advanced Portfolio Forecasting / Space & Portfolio Planning Console
Gap Analysis Chart
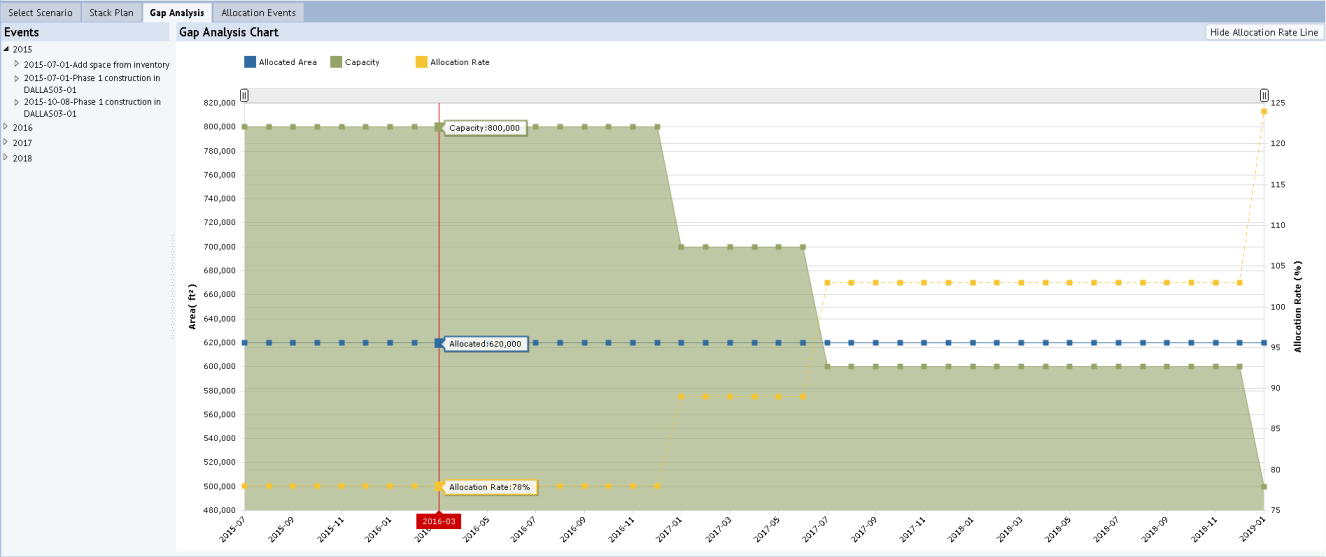
The Gap Analysis Chart, accessed from the Space & Portfolio Console's Gap Analysis tab, projects the space (or seats) allocated to events across all buildings, and compares it against the available floor space (or seat) in each time period. This chart can illustrate the periods when the projected allocation exceeds the available amount (over-allocation) and the periods when the allocation is less than the available (under-allocation). You can have the chart present area-based or seat-based statistics by selecting the Area View or Occupancy View button.
The area-based statistics are as follows. The following image presents area-based statistics.
- Capacity
- Allocated Area
- Allocation Percentage
The seat-based statistics are:
- Occupied Seats
- Total Seats
- Occupancy Rate

All data for the Gap Analysis Chart comes from the allocations (as stored in the Groups table) where the chart date is between the values of gp.date_start and gp.date_end, or equal to gp.date_start. The Gap Analysis Chart restricts the data based on the locations and dates specified in the filter, located at the top of the view. If no date is specified in the filter, then the chart displays the entire duration of the portfolio.
The calculations are:
| Value | Chart Line Color | Calculation |
|---|---|---|
| Capacity (Area) | Green | Sum(gp.area_manual) where gp.allocation_type in (‘Usable Area – Owned’, ‘Usable Area – Leased’) minus sum (gp.area_manual) where gp.allocation_type = ‘Unavailable Area’ |
| Allocated Area | Blue | Sum (gp.area_manual) where gp.allocation_type = ‘Allocated Area’ |
| Allocation Percentage | Yellow | Allocated divided by Capacity, multiplied by 100 |
| Total Seats | Green | SELECT SUM(rm.cap_em) FROM rm WHERE <restriction (either building or floor level)> |
| Seats Occupied | Blue | SELECT SUM(gp.count_em) FROM gp WHERE <restriction (either building or floor level)> |
| Occupancy Rate | Yellow | Seats occupied / Total seats |
Hover your mouse over the chart, and the system displays a vertical red line with labels listing the exact values for each metric for the selected date.
If you wish, you can hide the allocation rate (yellow line) by choosing the Hide Allocation Rate Line button, located in the upper right corner. Similarly, you can hide Occupancy Rate Line when in Occupancy view. For information on working with charts, see HTML Charts.