Archibus SaaS / Space / Space Manager
Space / Space Inventory / Space Manager (Non-Transactional)
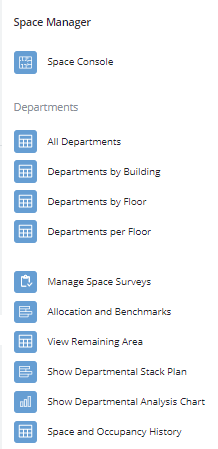
Space Manager Reports (non-transactional space inventory)
Once space managers develop a space inventory and make changes to it using the Space Console, they can use the Space Manager reports to analyze their inventory. The Space / Space Inventory / Space Manager process offers the following reports.
Departments By... reports
The All Departments summary report lists the departments to which rooms and groups have been assigned along with a count of the rooms and groups assigned to each department and the total area for each department. Click on any department for a breakdown of this department's rooms and groups on each floor. Examining the pop-up window for each department shows the exact groups and rooms, including their building and floor locations, that contribute to each department's total.
With the by Building and by Floor reports, you first select the building or floor and then access the total area of this item, broken down by department. Click on any department for a breakdown of the rooms and groups assigned to this department. Notice that for each department, the report includes the percentage of area that this department occupies out of the total departmental area for the building or floor.
Use the Departments per Floor report to determine how your departments are spread out among multiple floors. Select a department, and the system presents a listing of floors on which rooms and groups are assigned to this department. You can click on a floor to access the specific rooms and groups. If you find that your departments are spread out among multiple floors, you may wish to re-allocate space so that workers in the same department are located near one another, promoting a more efficient work environment.
Allocation and Benchmarks report
For information, see Allocation and Benchmarks report.
Remaining Area
Because of the cost of the space and the goal to maximize its use, many sites wish to account for every area on a floor. Space managers can use the Remaining Area report to determine the amount of area that was not captured in the space inventory. The report shows the remaining area for each floor and sums remaining area to the building.
A significant remaining area can indicate that the room and group polylines were not accurately drawn; space managers may ask CAD specialists to return to the drawings to adjust the polylines and capture all areas.
For more information on remaining area, including how to charge departments for it, see Remaining Area (concept).
Departmental Stack Plan
Note: For this report, you must first enter a building and floor in the filter pane at the top of the report.
Enter a building and floor, and the report presents a stack plan for the floor -- a graphical representation of space usage by department. Use a stack plan to quickly visually see how a floor's area is divided among departments.
The stack plan presents a bar representing the floor's total area and is divided into colors for each department, with each color sized to represent the department's portion of space on the floor. For example, if the Accounting department occupies 60 percent of floor HQ-18 and is represented by the color blue, the blue color will represent 60 percent of the bar. Click on any department to get the details of the rooms and groups assigned to that department.
Departmental Analysis Chart
Use this task to quickly see the percentage of space each department occupies on a floor by viewing a pie chart. Choose a floor, and the system presents a pie chart showing how the area on that floor is divided among departments. Mouse over each wedge of the pie for the percentage of area, total area for this department, and the name of the department. The department summary beneath the pie shows the count of records contributing to each department's total.
Space and Occupancy History
For information, see Space and Occupancy History report.