Real Property / Portfolio / Portfolio Summary
Portfolio Summary Dashboard
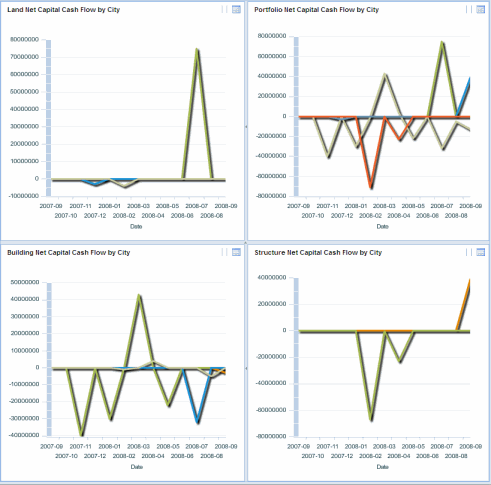
The Real Property / Portfolio / Portfolio Summary / Portfolio Summary Dashboard includes a chart showing your net capital cash flow for your entire portfolio, and separate charts of the breakdown for the building, structures, and land included in the total. You can filter the report by geography, whether the item is owned or leased, or by time span. By default, the chart shows data for owned portfolio items for the past year.
By default, the Portfolio Summary Dashboard shows the following key performance indicator charts. Your business process owner can customize the dashboard view to include charts with different groupings:
- Portfolio Summary Net Capital Cash Flow by City
- Land Net Capital Cash Flow by City
- Buildings Net Capital Cash Flow by City
- Structures Net Capital Cash Flow by City
Portfolio Summary Dashboard When Using the Archibus Enhanced Global Feature Set
If you are using the Archibus Enhanced Global Feature Set, Net Capital Cash Flow is shown using your User Default Currency. Net Capital Cash Flow is calculated as the Purchase Cost - Selling Cost, and does not include the VAT amount, as this chart is used for internal analysis for which VAT is not relevant.
Maximizing the Chart View
From the dashboard, you can maximize the view for a chart by clicking the Maximize button  . From the maximized view, you can filter the data shown in the chart, or generate the chart as a report. See Key Performance Indicator Chart Title Bar Icons.
The following image shows the Portfolio Summary dashboard:

See Also
Key Performance Indicator Charts Overview