Archibus SaaS / Maintenance / Reports
Maintenance / Preventive Maintenance / Management Reports
Maintenance / Corrective Maintenance / Management Reports
Maintenance Analysis Dashboards
The Corrective Maintenance and Preventive Maintenance dashboards include a set of analysis dashboards. These analysis dashboards combine on one screen various reports from the Operational Reports and Management Report processes so that executives can easily see at one time key trends and summaries.
The analysis dashboards are:
| Dashboard | Description |
|---|---|
| Budget Analysis | Used by finance managers to answer questions such as: How did prior budgets align to costs? How does planned work compare to budgets? How can we improve planning? |
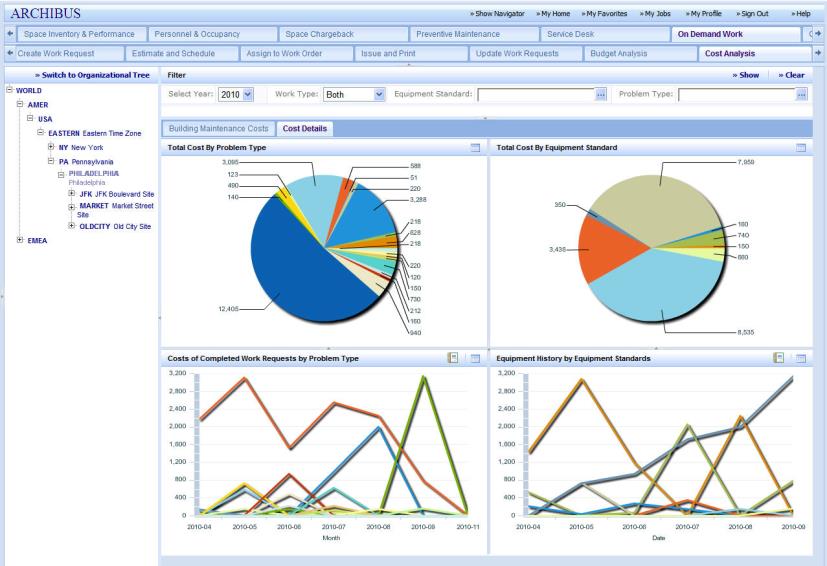
| Cost Analysis | Used by maintenance and financial personnel to analyze the historical maintenance costs of the site. Answers such questions as: What are the primary drivers of maintenance costs? How do buildings compare in maintenance costs? Which buildings are trending higher? What are the historical equipment costs and how are they trending? For details, see Cost Analysis Dashboard |
| Labor Analysis | Used by maintenance managers in evaluating the utilization and performance of their work teams. Answers such questions as: How did work teams perform in comparison to their goals? How did the current labor force meet maintenance demands? What work may require additional attention? |
Access the analysis dashboards from:
- Maintenance / Preventive Maintenance / Management Reports
- Maintenance / Corrective Maintenance / Management Reports
The reports and data shown by the analysis dashboards derive from the Operational Reports and Management Reports processes. Therefore, users can consult the Management Reports and Operational Reports topics for information on the exact reports presented by the dashboards.
These dashboards have a few unique features:
- Some of the reports in the Labor Analysis dashboard include a button for generating a service request. If the dashboard shows that you have some anomalies -- such as significant overdue work, too much open work, over-scheduled craftspersons, and so on -- you can create directly from the dashboard a service request to ask a supervisor to investigate this problem.
- The dashboards present the organizational hierarchy tree or the geographical tree in the left panel. Drill down to any level presented in the tree, choose the Show button in the upper right corner, and the program recalculates and redisplays the charts using data only at the selected level. For example, as shown in the above image, you can drill down to Philadelphia, PA, USA to see maintenance data for only buildings in this city. Further refine your data by using the options in the filter console.
- The dashboards typically display charts. You can access the data in an alphanumeric report by choosing the Report button in the upper right corner of the chart.
The Financial Analysis Dashboard: Cost per Area
When examining the Financial Analysis dashboard in conjunction with the organizational or location hierarchies, note that Cost per Area is a metric that does not “roll up” simply by adding values of subordinate levels, similar to the way that individual “cost” or “area” values roll up. For example, if a report is showing building costs only, then costs at the site, city, or region roll up by adding all building cost values within the geographic level. Since cost per area is a quotient, it cannot be added; the roll-up value is determined by adding the numerator, adding the denominator, and then putting them together, such as:
Cost per Area (site) = sum(costs of all buildings on that site) / sum(areas of all buildings on that site)