Capital Projects / Condition Assessment / Operational Reports
Capital Projects / Commissioning / Construction
Sustainability & Risk / Sustainability Assessment / Operational Reports
Sustainability & Risk / Hazard Abatement / Operational Reports
Sustainability & Risk / Hazard Abatement / Management Reports
Scoreboard Reports
The following reports present a graphical summary of assessment data.
Use these Scoreboards to quickly gain an overview of the current state of your facility, and then to drill down to more detailed data.
With the Scoreboard reports, you can quickly see the most urgent tasks and the estimated costs of resolving them. You can then decide which items you will immediately address and which you need to postpone.
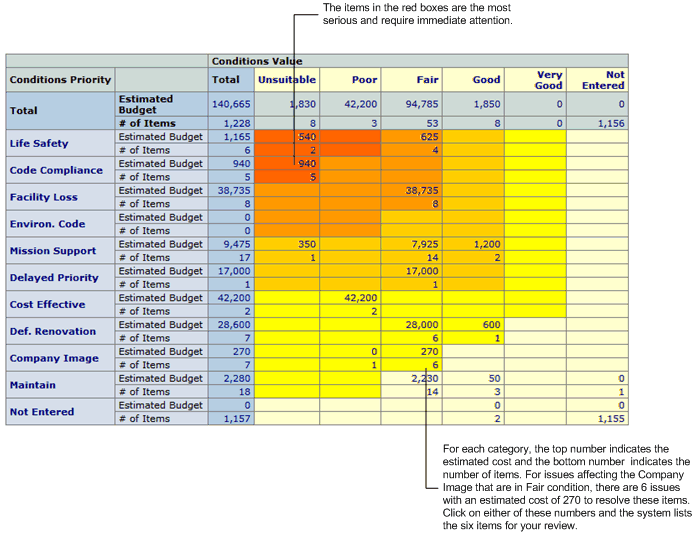
Note: The below image shows the Condition Assessment Scoreboard report; the Environmental Sustainability Assessment Scoreboard is similar except that it presents Sustainability Priority values in the far left column and reports on sustainability ratings.
Similarly, the Hazardous Material Scoreboard reports on hazmat condition ratings.

Setting the Restriction
When you run the task, you must first select a project. If you wish, you can set a restriction to see only items of a particular building or floor or for a specified time period. You may wish to check the urgency of the current work in progress; if so, you can set a restriction that includes only items for which work requests are in progress.
Reading the Chart
Once you complete the restriction, the system presents a chart based on the condition rating, the environmental sustainability rating, or the hazmat condition ratings of assessment items. Condition Priority (or Sustainability Priority) is listed vertically, and Condition Value is listed horizontally. At the intersection of these headings are cells that store an aggregate of assessment items whose Priority and Condition Value correspond to these headings, such as items whose priority are Facility Loss and whose values are Fair.
Items in the upper left corner of the scoreboard window are the most urgent since the Condition Priority (or Sustainability Priority) value is highest and the Condition Value is the most severe. Accordingly, these items are indicated in red. Moving right and down the scoreboard (to shades of orange and yellow) shows items with less severe values for Condition/Sustainability Priority and Condition Value.
For each hazmat condition rating, condition rating, or environmental sustainability rating, the scoreboard lists the number of assessment items of this rating and the estimated cost of addressing these items. In order for the scoreboard to show cost data, assessment managers must first enter estimated cost information for assessment items. See Estimating Costs of Addressing Efficiencies or Estimating Costs of Addressing Hazmat Deficiencies
Getting More Details
You can select any cell in the scoreboard to drill down to the assessment items that have the Condition Priority/Sustainability Priority and Condition Value that correspond to that cell. The program displays the assessment items in the Assessment Items tab for your review.
Take note of the assessment items that need attention so that you can return to the Manage Assessment Items task and manage the resolution of these items.
Example
In the HQ sample project, if you display the scoreboard for the ASSESSMENT-HQ-2003-QTR-2 condition assessment project, the upper left entry of the scoreboard shows the most crucial category: a Life Safety issues whose values are Uacceptable. To see more detail about the items in this category, click on the estimated cost or number of items for this category and the system displays a list of the assessment items whose Condition Priority is "Life Safety" and whose Condition Value is "Unacceptable."