Leaflet Map Control
Use Thematic (Unique Value) Markers in a Map
Technologies > User Interface Add-Ins > Geographic Information System (GIS) Views > Thematic (Unique Value) Markers (Leaflet)
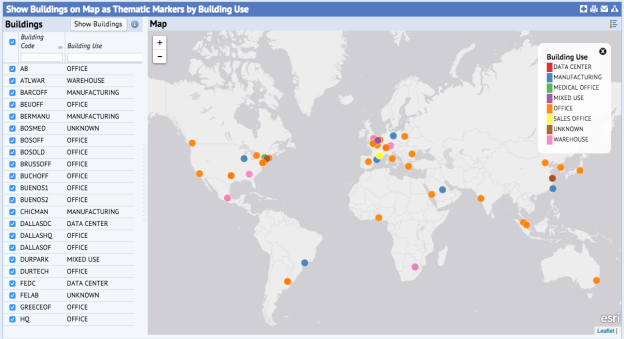
This example displays thematic markers by building use. Markers are colored according to building use where each building use is represented a unique color. A marker legend defining the marker classes appears on the map.
To use thematic markers, add the required thematic marker options to markerProperties. By specifying an empty array for uniqueValues, the map control will automatically determine and include all the distinct building use values. Alternatively, you may specify the values to include. This approach uses the thematic-unique-values renderer.
var markerProperties = {
//optional
radius: 7,
fillColor: '#e41a1c',
fillOpacity: 0.90,
stroke: true,
strokeColor: '#fff',
strokeWeight: 1.0,
// required for thematic markers
renderer: 'thematic-unique-values',
thematicField: 'bl.use1',
uniqueValues: [],
colorBrewerClass: 'Set1'
};
this.mapControl.createMarkers(
dataSource,
geometryFields,
titleField,
contentFields,
markerProperties
);
To display the markers, create the restriction and show the markers:
<action id="showLegend" imageName="/schema/ab-core/graphics/icons/view/ab-arcgis-legend-16.png">
<tooltip>Legend</tooltip>
</action>
To include a marker legend, include a showLegend panel action in AXVW:
<action id="showLegend" imageName="/schema/ab-core/graphics/icons/view/ab-arcgis-legend-16.png">
<tooltip>Legend</tooltip>
</action>
To show the legend, add an event handler in the JS:
var legendObj = Ext.get('showLegend');
legendObj.on('click', this.showLegend, this, null);
showLegend: function(){
mapController.mapControl.showMarkerLegend();
}
View: http://localhost:8080/archibus/ab-leaflet-map-thematic-unique-value-renderer.axvw